TipsAndTricks/DebuggingBitbakeInWingIDE
Why
If you find the pudb environment too bare bones and old fashioned (I do) and wanted a more modern debug experience, you may want to try using the WindIDE debugger: https://wingware.com/. I am pretty sure the same could be done with PyCharm: https://www.jetbrains.com/pycharm/ but I have only done Wing so far. The below assumes you have installed the WingIDE Personal. I used the deb on an ubuntu box.
Goal
I wanted to be able to step through some of the more complex code and see stacks, variables, etc.as well as setting breakpoints. I wanted to be able to do this in bitbake proper aka bitbake/lib/bb/cooker.py for instance, as well as in the metadata e.g. poky/meta/classes/native.bbclass.
---
I managed to be able to do both of the above, but not, unfortunately simultaneously. This may be because I have something misconfigured or for some limitation of the debuggers remote connection ability. This is how I set up the 2 scenarios.
Debug Core Bitbake or a Bitbake Tool
This details how to configure the WingIDE Personal debugger to debug core bitbake (e.g. bitbake/lib/bb/main.py) or a particular tool (e.g. poky/scripts/oe-check-sstate). This is useful if you are trying to understand the program flow or look at some variables w/out adding a bunch of logger.warn(;;;) statements.
- Turn on the Debuggers ability to accept incoming connections . Edit->Preferences->External/Remote. All I did was accept the defaults and hit the checkbox to turn it on.
[File:WingRemoteDebugOn.png|x200px]] - make a new project
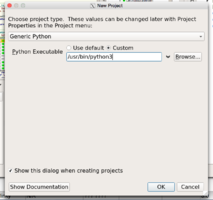
- set the interpreter to be python3 ->
- add the bitbake/bin bitbake/lib and scripts/lib to the project. Right click in the are to the right where the tab says project and select Add Directory....
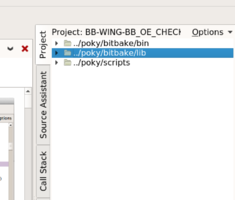
- Now you need to help the Source Parser know about the bb libs. Add bitbake/libs and poky/script/libs into the Python Path the IDE knows about. Select Project Properties and add those to the PYTHONPATH.
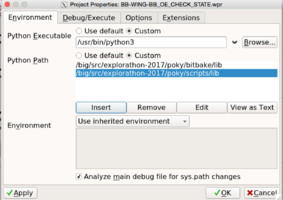
- You also need to tell the debugger to start in the build directory. By default, it will start in the directory the file you are debugging is in. e.g. bitbake/bin.
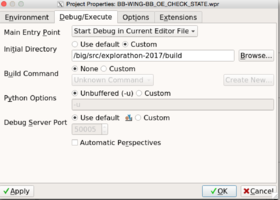
- Then you can pull up files and add a breakpoint. In this example I put a bp in oe-check-sstate itself.
- Bring up oe-check-sstate from the poky/scripts and right click to say "Debug this file". This will bring up a dialog box and you can type in the target. For example autoconf-native.
- If Wing doesn't recognize a file as python, you can right click on the file and set the type via File Properties.
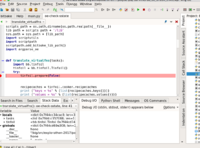
- Then you will hit the bp in oe-check-sstate.
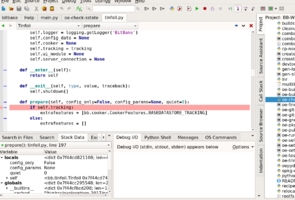
- and you can step into tinfoil.py which is in bitbake/lib/bb!
- You can put bp in any other non meta-data file. You can also start bitbake/bin/bitbake this way and hit the breakpoints...
Debug Bitbake Metadata
Because the metadata is interpreted as part of bitbake parsing/execution, we need to approach this differently. The below steps worked for me. There may be a better way if someone has more knowledge of the Wing Remote Debug interface. Sometimes, I just want to be able to break in a metadata file and see what is happening and what the state is.
- Make a new project
- First, set up everything as before with respect to the remote debugger, python interpreter, and project properties.
- add the poky/meta directory
- We will bring up the meta/classes/native.bbclass and the poky/meta/recipes-devtools/quilt/quilt-native.inc
- Like we did in the pudb example, we will add some python to the quilt-native.inc file as an example. Add :
python () {
  import sys
  import wingdbstub
  i=5
  for j in range(i):
    print("\nCOWZ IN QUILT_NATIVE.INC\n")
  print("\n VERSION=",sys.version,"\n")
}
After the line EXTRA_OECONF = "--disable-nls"
