TipsAndTricks/DebuggingBitbakeInWingIDE: Difference between revisions
No edit summary |
No edit summary |
||
| Line 11: | Line 11: | ||
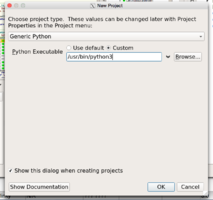
* set the interpreter to be python3 -><br> | * set the interpreter to be python3 -><br> | ||
[[File:WingProjectPython.png|x200px]] | [[File:WingProjectPython.png|x200px]] | ||
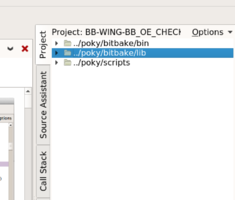
* add the bitbake/bin bitbake/lib and scripts/lib to the project. Right click in the are to the right where the tab says project. <br>[[File:WingAddBB.png|x200px] | * add the bitbake/bin bitbake/lib and scripts/lib to the project. Right click in the are to the right where the tab says project. <br>[[File:WingAddBB.png|x200px]] | ||
Revision as of 21:42, 10 March 2017
Why
If you find the pudb environment too bare bones and old fashioned (I do) and wanted a more modern debug experience, you may want to try using the WindIDE debugger: https://wingware.com/. I am pretty sure the same could be done with PyCharm: https://www.jetbrains.com/pycharm/ but I have only done Wing so far. The below assumes you have installed the WingIDE Personal. I used the deb on an ubuntu box.
Goal
I wanted to be able to step through some of the more complex code and see stacks, variables, etc.as well as setting breakpoints. I wanted to be able to do this in bitbake proper aka bitbake/lib/bb/cooker.py for instance, as well as in the metadata e.g. poky/meta/classes/native.bbclass.
---
I managed to be able to do both of the above, but not, unfortunately simultaneously. This may be because I have something misconfigured or for some limitation of the debuggers remote connection ability. This is how I set up the 2 scenarios.
Debug Core Bitbake or a Bitbake Tool
This details how to configure the WingIDE Personal debugger to debug core bitbake (e.g. bitbake/lib/bb/main.py) or a particular tool (e.g. poky/scripts/oe-check-sstate). This is useful if you are trying to understand the program flow or look at some variables w/out adding a bunch of logger.warn(;;;) statements.
- make a new project
- set the interpreter to be python3 ->

