TipsAndTricks/DebuggingBitbakeInWingIDE: Difference between revisions
No edit summary |
Tim Orling (talk | contribs) (→Debug Core Bitbake or a Bitbake Tool: Fix image link for Remote Debug) |
||
| (2 intermediate revisions by one other user not shown) | |||
| Line 8: | Line 8: | ||
=== Debug Core Bitbake or a Bitbake Tool === | === Debug Core Bitbake or a Bitbake Tool === | ||
This details how to configure the WingIDE Personal debugger to debug core bitbake (e.g. bitbake/lib/bb/main.py) or a particular tool (e.g. poky/scripts/oe-check-sstate). This is useful if you are trying to understand the program flow or look at some variables w/out adding a bunch of logger.warn(;;;) statements. | This details how to configure the WingIDE Personal debugger to debug core bitbake (e.g. bitbake/lib/bb/main.py) or a particular tool (e.g. poky/scripts/oe-check-sstate). This is useful if you are trying to understand the program flow or look at some variables w/out adding a bunch of logger.warn(;;;) statements. | ||
* Turn on the Debuggers ability to accept incoming connections . Edit->Preferences->External/Remote. All I did was accept the defaults and hit the checkbox to turn it on.<br>[File:WingRemoteDebugOn.png|x200px]] | * Turn on the Debuggers ability to accept incoming connections . Edit->Preferences->External/Remote. All I did was accept the defaults and hit the checkbox to turn it on.<br>[[File:WingRemoteDebugOn.png|x200px]] | ||
* make a new project | * make a new project | ||
* set the interpreter to be python3 -><br> | * set the interpreter to be python3 -><br> | ||
| Line 23: | Line 23: | ||
[[File:WingSetBP-step-tinfoil.png |x200px]] | [[File:WingSetBP-step-tinfoil.png |x200px]] | ||
* You can put bp in any other non meta-data file. You can also start bitbake/bin/bitbake this way and hit the breakpoints... | * You can put bp in any other non meta-data file. You can also start bitbake/bin/bitbake this way and hit the breakpoints... | ||
=== Debug Bitbake Metadata === | === Debug Bitbake Metadata === | ||
Because the metadata is interpreted as part of bitbake parsing/execution, we need to approach this differently. The below steps worked for me. There may be a better way if someone has more knowledge of the Wing Remote Debug interface. Sometimes, I just want to be able to break in a metadata file and see what is happening and what the state is. | Because the metadata is interpreted as part of bitbake parsing/execution, we need to approach this differently. The below steps worked for me. There may be a better way if someone has more knowledge of the Wing Remote Debug interface. Sometimes, I just want to be able to break in a metadata file and see what is happening and what the state is. | ||
| Line 57: | Line 58: | ||
BB_NUMBER_PARSE_THREADS="1" | BB_NUMBER_PARSE_THREADS="1" | ||
</code> | </code> | ||
* If you go back to debugging bitbake and it is really slow, check to see if you have commented out the above limitations since bb parses VERY slowly with only one thread. | |||
Latest revision as of 20:29, 26 July 2017
Why
If you find the pudb environment too bare bones and old fashioned (I do) and wanted a more modern debug experience, you may want to try using the WindIDE debugger: https://wingware.com/. I am pretty sure the same could be done with PyCharm: https://www.jetbrains.com/pycharm/ but I have only done Wing so far. The below assumes you have installed the WingIDE Personal. I used the deb on an ubuntu box.
Goal
I wanted to be able to step through some of the more complex code and see stacks, variables, etc.as well as setting breakpoints. I wanted to be able to do this in bitbake proper aka bitbake/lib/bb/cooker.py for instance, as well as in the metadata e.g. poky/meta/classes/native.bbclass.
---
I managed to be able to do both of the above, but not, unfortunately simultaneously. This may be because I have something misconfigured or for some limitation of the debuggers remote connection ability. This is how I set up the 2 scenarios.
Debug Core Bitbake or a Bitbake Tool
This details how to configure the WingIDE Personal debugger to debug core bitbake (e.g. bitbake/lib/bb/main.py) or a particular tool (e.g. poky/scripts/oe-check-sstate). This is useful if you are trying to understand the program flow or look at some variables w/out adding a bunch of logger.warn(;;;) statements.
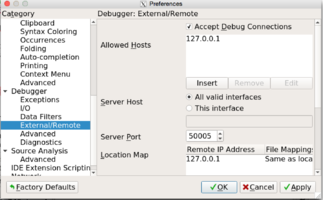
- Turn on the Debuggers ability to accept incoming connections . Edit->Preferences->External/Remote. All I did was accept the defaults and hit the checkbox to turn it on.
- make a new project
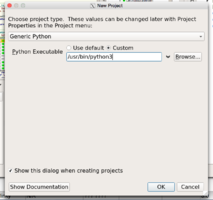
- set the interpreter to be python3 ->
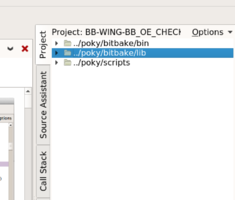
- add the bitbake/bin bitbake/lib and scripts/lib to the project. Right click in the are to the right where the tab says project and select Add Directory....
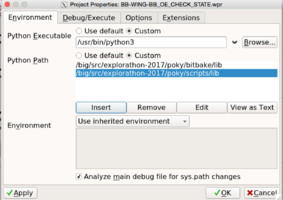
- Now you need to help the Source Parser know about the bb libs. Add bitbake/libs and poky/script/libs into the Python Path the IDE knows about. Select Project Properties and add those to the PYTHONPATH.
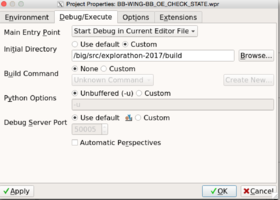
- You also need to tell the debugger to start in the build directory. By default, it will start in the directory the file you are debugging is in. e.g. bitbake/bin.
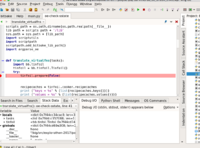
- Then you can pull up files and add a breakpoint. In this example I put a bp in oe-check-sstate itself.
- Bring up oe-check-sstate from the poky/scripts and right click to say "Debug this file". This will bring up a dialog box and you can type in the target. For example autoconf-native.
- If Wing doesn't recognize a file as python, you can right click on the file and set the type via File Properties.
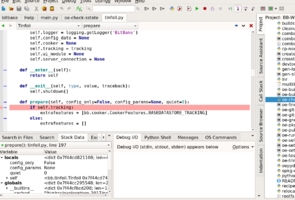
- Then you will hit the bp in oe-check-sstate.
- and you can step into tinfoil.py which is in bitbake/lib/bb!
- You can put bp in any other non meta-data file. You can also start bitbake/bin/bitbake this way and hit the breakpoints...
Debug Bitbake Metadata
Because the metadata is interpreted as part of bitbake parsing/execution, we need to approach this differently. The below steps worked for me. There may be a better way if someone has more knowledge of the Wing Remote Debug interface. Sometimes, I just want to be able to break in a metadata file and see what is happening and what the state is.
- Make a new project
- First, set up everything as before with respect to the remote debugger, python interpreter, and project properties.
- add the poky/meta directory
- We will bring up the meta/classes/native.bbclass and the poky/meta/recipes-devtools/quilt/quilt-native.inc
- Like we did in the pudb example, we will add some python to the quilt-native.inc file as an example. Add :
python () {
  import sys
  import wingdbstub
  i=5
  for j in range(i):
    print("\nCOWZ IN QUILT_NATIVE.INC\n")
  print("\n VERSION=",sys.version,"\n")
}
After the line EXTRA_OECONF = "--disable-nls"
- Note the line
import wingdbstub- this file should be copied from where the Wing IDE install put it (on ubuntu /usr/lib/wingide-personal6) to bitbake/lib. This is so that all the bitbake meta files can easily find it.
- this file tells how to talk to the Wing IDE debugger.
- Now you can pull up files like native.bbclass and quilt-native.inc and put breakpoints in them.
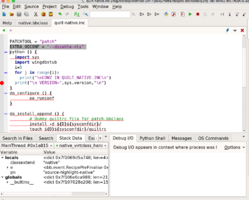
- Here's an example of breaking in native.bbclass:
- Caveats:
- You MUST start bitbake from the command line as normal, with your WingIDE up and running.
- You will MISS breakoints that are happening in other threads while you are stopped in a particular bp. For instance, if we had breakpoints in quilt-native.inc and in cmake_3.7.2.bb you will probably miss one of them while broke on the other one. For this reason, if you are debugging more than one metadata file at a time, you may need to set the following in your local.conf:
- Caveats:
# FOR Happier WING debugger
# single threaded parsing and building.
# parallel makes are fine...
BB_NUMBER_THREADS="1"
BB_NUMBER_PARSE_THREADS="1"
- If you go back to debugging bitbake and it is really slow, check to see if you have commented out the above limitations since bb parses VERY slowly with only one thread.
