Tracing and Profiling
Tracing and Profiling in Yocto
Yocto bundles a number of tracing and profiling tools - this 'HOWTO' describes their basic usage and more importantly shows by example how they fit together and how to make use of them to solve real-world problems.
The tools presented are for the most part completely open-ended and have quite good and/or extensive documentation of their own which can be used to solve just about any problem you might come across in Linux. Each section that describes a particular tool has links to that tool's documentation and website.
The purpose of this 'HOWTO' is to present a set of common and generally useful tracing and profiling idioms along with their application (as appropriate) to each tool, in the context of a general-purpose 'drill-down' methodology that can be applied to solving a large number (90%?) of problems. For help with more advanced usages and problems, please see the documentation and/or websites listed for each tool.
General Setup
Most of the tools are available only in 'sdk' images or in images built after adding 'tools-profile' to your local.conf. So, in order to be able to access all of the tools described here, please first build and boot an 'sdk' image e.g.
$ bitbake core-image-sato-sdk
or alternatively by adding 'tools-profile' to the EXTRA_IMAGE_FEATURES line in your local.conf:
EXTRA_IMAGE_FEATURES = "debug-tweaks tools-profile"
If you use the 'tools-profile' method, you don't need to build an sdk image - the tracing and profiling tools will be included in non-sdk images as well e.g.:
$ bitbake core-image-sato
Overall Architecture of the Linux Tracing and Profiling Tools
It may seem surprising to see a section covering an 'overall architecture' for what seems to be a random collection of tracing tools that together make up the Linux tracing and profiling space. The fact is, however, that in recent years this seemingly disparate set of tools has started to converge on a 'core' set of underlying mechanisms:
- static tracepoints
- dynamic tracepoints
- kprobes
- uprobes
- the perf_events subsystem
- debugfs
Tying It Together: Rather than enumerating here how each tool makes use of these common mechanisms, textboxes
                   like this will make note of the specific usages in each tool as they come up in the course
                   of the text.
A Few Real-world Examples
Custom Top
Yocto Bug 3049
Slow write speed on live images with denzil
Autodidacting the Graphics Stack
Using ftrace, perf, and systemtap to learn about the i915 graphics stack.
Determining whether 3-D rendering is using the hardware (without special test-suites)
The standard (simple) 3-D graphics programs can't always be used to unequivocally determine whether hardware rendering or a fallback software rendering mode is being used e.g. PVR graphics. We can however use the tracing tools to unequivocally determine whether hardware or software rendering is being used regardless of what the test programs are telling us, or in spite of the fact that we may be using a proprietary stack.
This example will provide a simple yes/no test based on tracing output.
Basic Usage (with examples) for each of the Yocto Tracing Tools
perf
The 'perf' tool is the profiling and tracing tool that comes bundled with the Linux kernel.
Don't let the fact that it's part of the kernel fool you into thinking that it's only for tracing and profiling the kernel - you can indeed use it to trace and profile just the kernel , but you can also use it to profile specific applications separately (with or without kernel context), and you can also use it to trace and profile the kernel and all applications on the system simultaneously to gain a system-wide view of what's going on in the system.
In many ways, it aims to be a superset of all the tracing and profiling tools available in Linux today, including all the other tools covered in this HOWTO. The past couple of years have seen perf subsume a lot of the functionality of those other tools, and at the same time those other tools have removed large portions of their previous functionality and replaced it with calls to the equivalent functionality now implemented by the perf subsystem. Extrapolation suggests that at some point those other tools will simply become completely redundant and go away; until then, we'll cover those other tools in these pages and in many cases show how the same things can be accomplished in perf and the other tools when it seems useful to do so.
The coverage below details some of the most common ways you'll likely want to apply the tool; full documentation can be found either within the tool itself or in the man pages:
Setup
For this section, we'll assume you've already performed the basic setup outlined in the General Setup section.
In addition, for use in illustrating the steps involved in profiling a 'real-world' application, enable the 'web2' browser in yocto by adding the following line to your local.conf:
WEB = "web-webkit"
Basic Usage
The perf tool is pretty much self-documenting. To remind yourself of the available commands, simply type 'perf', which will show you basic usage along with the available perf subcommands:
root@crownbay:~# perf

usage: perf [--version] [--help] COMMAND [ARGS]

The most commonly used perf commands are:
  annotate        Read perf.data (created by perf record) and display annotated code
  archive         Create archive with object files with build-ids found in perf.data file
  bench           General framework for benchmark suites
  buildid-cache   Manage build-id cache.
  buildid-list    List the buildids in a perf.data file
  diff            Read two perf.data files and display the differential profile
  evlist          List the event names in a perf.data file
  inject          Filter to augment the events stream with additional information
  kmem            Tool to trace/measure kernel memory(slab) properties
  kvm             Tool to trace/measure kvm guest os
  list            List all symbolic event types
  lock            Analyze lock events
  probe           Define new dynamic tracepoints
  record          Run a command and record its profile into perf.data
  report          Read perf.data (created by perf record) and display the profile
  sched           Tool to trace/measure scheduler properties (latencies)
  script          Read perf.data (created by perf record) and display trace output
  stat            Run a command and gather performance counter statistics
  test            Runs sanity tests.
  timechart       Tool to visualize total system behavior during a workload
  top             System profiling tool.

See 'perf help COMMAND' for more information on a specific command.
Using perf to do some basic profiling
As a simple test case, we'll profile the 'wget' of a fairly large file, which is a minimally interesting case because it has both file and network I/O aspects, and at least in the case of standard Yocto images, it's implemented as part of busybox, so the methods we use to analyze it can be used in a very similar way to the whole host of supported busybox applets in Yocto.
root@crownbay:~# rm linux-2.6.19.2.tar.bz2; wget http://downloads.yoctoproject.org/mirror/sources/linux-2.6.19.2.tar.bz2
The quickest and easiest way to get some basic overall data about what's going on for a particular workload it to profile it using 'perf stat'. 'perf stat' basically profiles using a few default counters and displays the summed counts at the end of the run:
root@crownbay:~# perf stat wget http://downloads.yoctoproject.org/mirror/sources/linux-2.6.19.2.tar.bz2
Connecting to downloads.yoctoproject.org (140.211.169.59:80)
linux-2.6.19.2.tar.b 100% |***************************************************| 41727k  0:00:00 ETA

Performance counter stats for 'wget http://downloads.yoctoproject.org/mirror/sources/linux-2.6.19.2.tar.bz2':

      4597.223902 task-clock                #    0.077 CPUs utilized
            23568 context-switches          #    0.005 M/sec
               68 CPU-migrations            #    0.015 K/sec
              241 page-faults               #    0.052 K/sec
       3045817293 cycles                    #    0.663 GHz
  <not supported> stalled-cycles-frontend
  <not supported> stalled-cycles-backend
        858909167 instructions              #    0.28  insns per cycle
        165441165 branches                  #   35.987 M/sec
         19550329 branch-misses             #   11.82% of all branches

     59.836627620 seconds time elapsed
Many times such a simple-minded test doesn't yield much of interest, but sometimes it does (see Real-world Yocto bug (slow loop-mounted write speed)).
Also, note that 'perf stat' isn't restricted to a fixed set of counters - basically any event listed in the output of 'perf list' can be tallied by 'perf stat'. For example, suppose we wanted to see a summary of all the events related to kernel memory allocation/freeing along with cache hits and misses:
root@crownbay:~# perf stat -e kmem:* -e cache-references -e cache-misses wget http://downloads.yoctoproject.org/mirror/sources/linux-2.6.19.2.tar.bz2
Connecting to downloads.yoctoproject.org (140.211.169.59:80)
linux-2.6.19.2.tar.b 100% |***************************************************| 41727k  0:00:00 ETA

Performance counter stats for 'wget http://downloads.yoctoproject.org/mirror/sources/linux-2.6.19.2.tar.bz2':

             5566 kmem:kmalloc
           125517 kmem:kmem_cache_alloc
                0 kmem:kmalloc_node
                0 kmem:kmem_cache_alloc_node
            34401 kmem:kfree
            69920 kmem:kmem_cache_free
              133 kmem:mm_page_free
               41 kmem:mm_page_free_batched
            11502 kmem:mm_page_alloc
            11375 kmem:mm_page_alloc_zone_locked
                0 kmem:mm_page_pcpu_drain
                0 kmem:mm_page_alloc_extfrag
         66848602 cache-references
          2917740 cache-misses              #    4.365 % of all cache refs

     44.831023415 seconds time elapsed
So 'perf stat' gives us a nice easy way to get a quick overview of what might be happening for a set of events, but normally we'd need a little more detail in order to understand what's going on in a way that we can act on in a useful way.
To dive down into a next level of detail, we can use 'perf record'/'perf report' which will collect profiling data and present it to use using an interactive text-based UI (or simply as text if we specify --stdio to 'perf report').
As our first attempt at profiling this workload, we'll simply run 'perf record', handing it the workload we want to profile (everything after 'perf record' and any perf options we hand it - here none - will be executedin a new shell). perf collects samples until the process exits and records them in a file named 'perf.data' in the current working directory.
root@crownbay:~# perf record wget http://downloads.yoctoproject.org/mirror/sources/linux-2.6.19.2.tar.bz2

Connecting to downloads.yoctoproject.org (140.211.169.59:80)
linux-2.6.19.2.tar.b 100% |************************************************| 41727k  0:00:00 ETA
[ perf record: Woken up 1 times to write data ]
[ perf record: Captured and wrote 0.176 MB perf.data (~7700 samples) ]
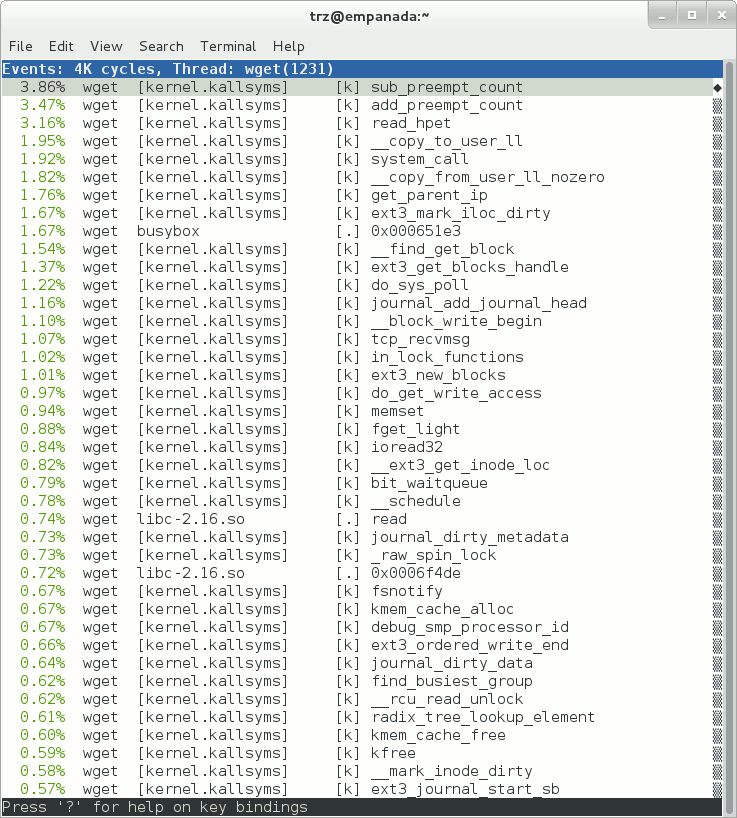
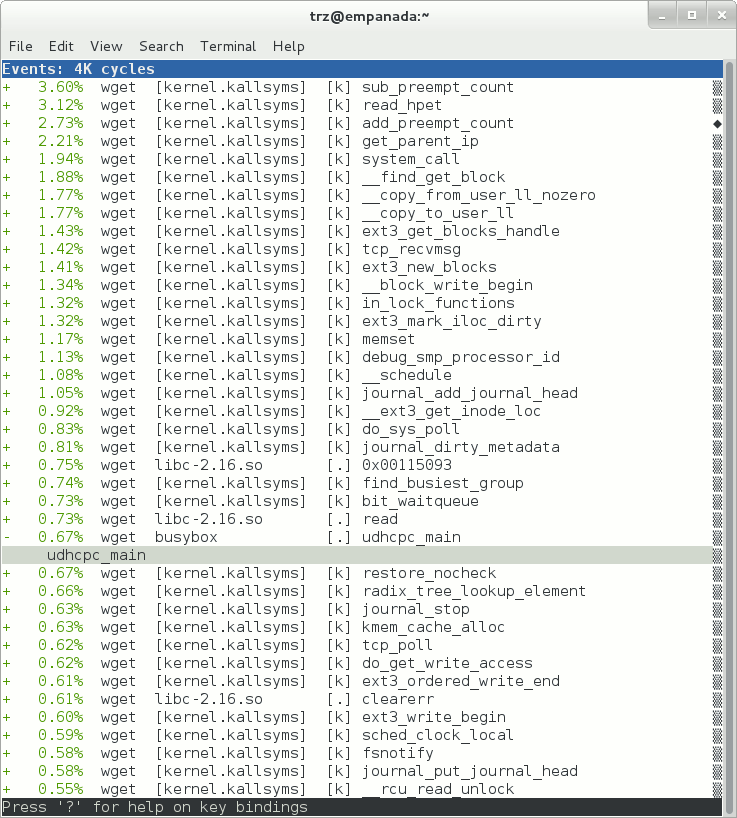
To see the results in a 'text-based UI' (tui), simply run 'perf report', which will read the perf.data file in the current working directory and display the results in an interactive UI:
root@crownbay:~# perf report
The above screenshot displays a 'flat' profile, one entry for each 'bucket' corresponding to the functions that were profiled during the profiling run, ordered from the most popular to the least (perf has options to sort in various orders and keys as well as display entries only above a certain threshold and so on - see the perf documentation for details). Note that this includes both userspace functions (entries containing a [.]) and kernel functions accounted to the process (entries containing a [k]). (perf has command-line modifiers that can be used to restrict the profiling to kernel or userspace, among others).
Notice also that the above report shows an entry for 'busybox', which is the executable that implements 'wget' in Yocto, but that instead of a useful function name in that entry, it displays an not-so-friendly hex value instead. The steps below will show how to fix that problem.
Before we do that, however, let's try running a different profile, one which shows something a little more interesting. The only difference between the new profile and the previous one is that we'll add the -g option, which will record not just the address of a sampled function, but the entire callchain to the sampled function as well:
root@crownbay:~# perf record -g wget http://downloads.yoctoproject.org/mirror/sources/linux-2.6.19.2.tar.bz2
Connecting to downloads.yoctoproject.org (140.211.169.59:80)
linux-2.6.19.2.tar.b 100% |************************************************| 41727k  0:00:00 ETA
[ perf record: Woken up 3 times to write data ]
[ perf record: Captured and wrote 0.652 MB perf.data (~28476 samples) ]
root@crownbay:~# perf report
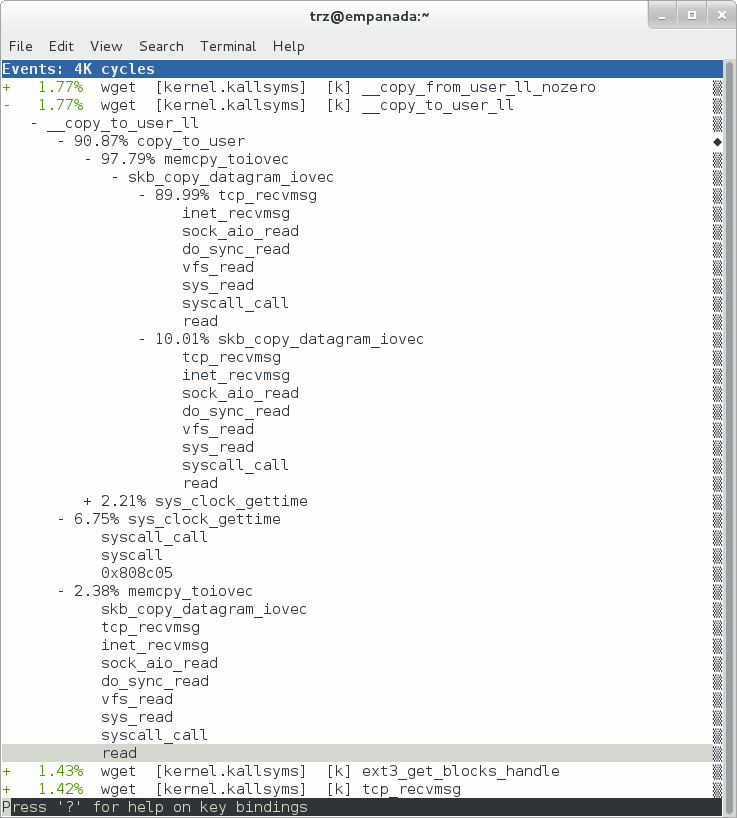
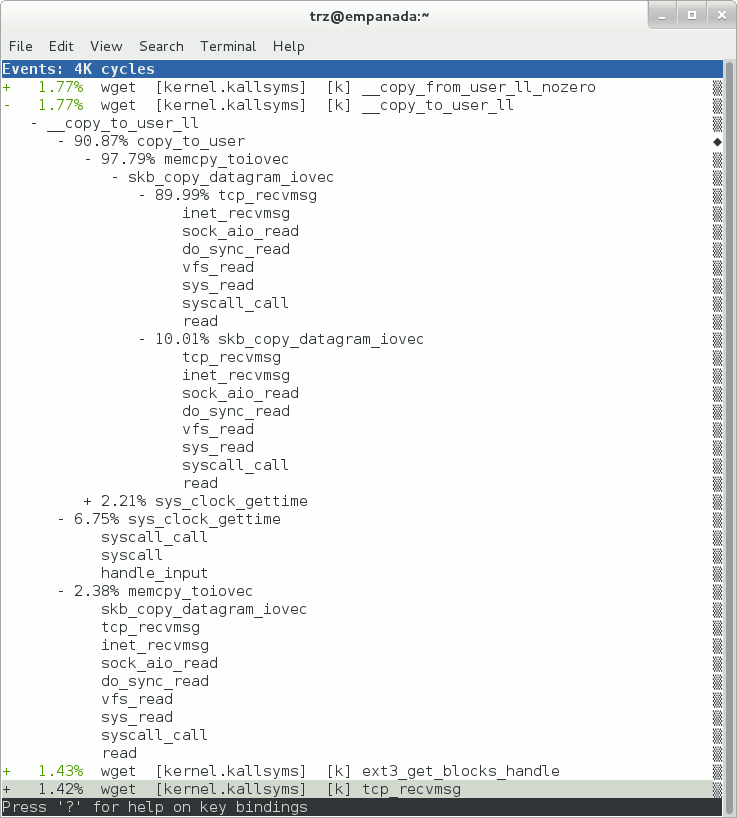
Using the callgraph view, we can actually see not only which functions took the most time, but we can also see a summary of how those functions were called and learn something about how the program interacts with the kernel in the process.
Notice that each entry in the above screenshot now contains a '+' on the left-hand side. This means that we can expand the entry and drill down into the callchains that feed into that entry. Pressing 'enter' on any one of them will expand the callchain (you can also press 'E' to expand them all at the same time or 'C' to collapse them all).
In the screenshot above, we've toggled the __copy_to_user_ll() entry and several subnodes all the way down. This lets us see which callchains contributed to the profiled __copy_to_user_ll() function which contributed 1.77% to the total profile.
As a bit of background explanation for these callchains, think about what happens at a high level when you run wget to get a file out on the network. Basically what happens is that the data comes into the kernel via the network connection (socket) and is passed to the userspace program 'wget' (which is actually a part of busybox, but that's not important for now), which takes the buffers the kernel passes to it and writes it to a disk file to save it.
The part of this process that we're looking at in the above call stacks is the part where the kernel passes the data it's read from the socket down to wget i.e. a copy-to-user.
Notice also that here there's also a case where the a hex value is displayed in the callstack, here in the expanded sys_clock_gettime() function. Later we'll see it resolve to a userspace function call in busybox.
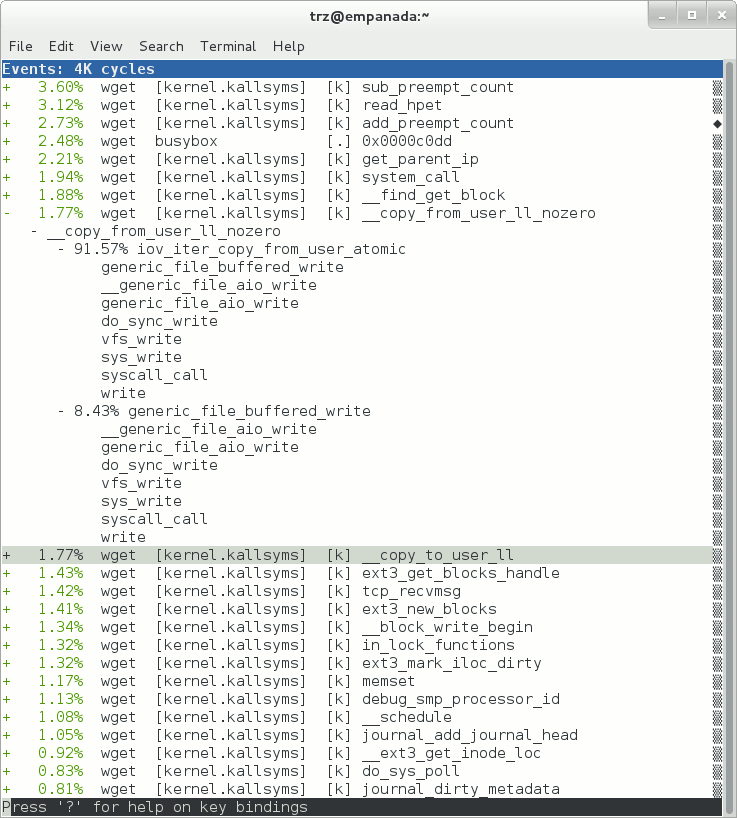
The above screenshot shows the other half of the journey for the data - from the wget program's userspace buffers to disk. To get the buffers to disk, the wget program issues a write(2), which does a copy-from-user to the kernel, which then takes care via some circuitous path (probably also present somewhere in the profile data), to get it safely to disk.
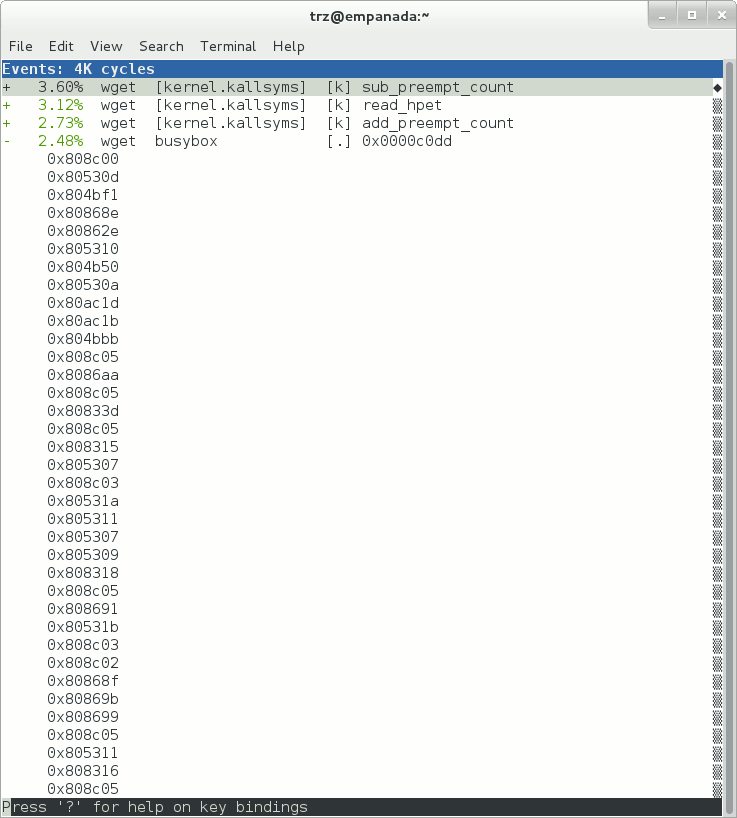
Now that we've seen the basic layout of the profile data and the basics of how to extract useful information out of it, let's get back to the task at hand and see if we can get some basic idea about where the time is spent in the program we're profiling, wget. Remember that wget is actually implemented as an applet in busybox, so while the process name is 'wget', the executable we're actually interested in is busybox. So let's expand the first entry containing busybox:
Again, before we expanded we saw that the function was labeled with a hex value instead of a symbol as with most of the kernel entries. Expanding the busybox entry doesn't make it any better.
The problem is that perf can't find the symbol information for the busybox binary, which is actually stripped out by the Yocto build system.
One way around that is to put the following in your local.conf when you build the image:
INHIBIT_PACKAGE_STRIP = "1"
However, we already have an image with the binaries stripped, so what can we do to get perf to resolve the symbols? Basically we need to install the debuginfo for the busybox package.
To generate the debug info for the packages in the image, we can to add dbg-pkgs to EXTRA_IMAGE_FEATURES in local.conf. For example:
EXTRA_IMAGE_FEATURES = "debug-tweaks tools-profile dbg-pkgs"
Additionally, in order to generate the type of debuginfo that perf understands, we also need to add the following to local.conf:
PACKAGE_DEBUG_SPLIT_STYLE = 'debug-file-directory'
Once we've done that, we can install the debuginfo for busybox. The debug packages once built can be found in build/tmp/deploy/rpm/* on the host system. Find the busybox-dbg-...rpm file and copy it to the target. For example:
[trz@empanada core2]$ scp /home/trz/yocto/crownbay-tracing-dbg/build/tmp/deploy/rpm/core2/busybox-dbg-1.20.2-r2.core2.rpm root@192.168.1.31:
root@192.168.1.31's password:
busybox-dbg-1.20.2-r2.core2.rpm                     100% 1826KB   1.8MB/s   00:01
Now install the debug rpm on the target:
root@crownbay:~# rpm -i busybox-dbg-1.20.2-r2.core2.rpm
Now that the debuginfo is installed, we see that the busybox entries now display their functions symbolically:
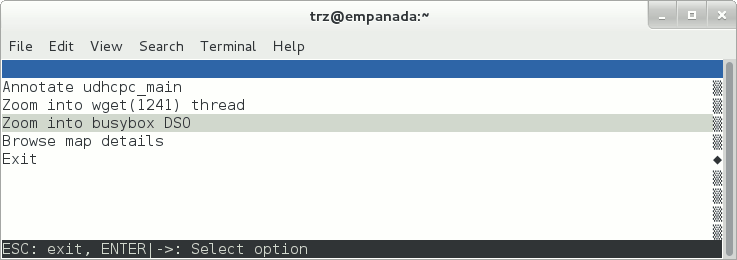
If we expand one of the entries and press 'enter' on a leaf node, we're presented with a menu of actions we can take to get more information related to that entry:
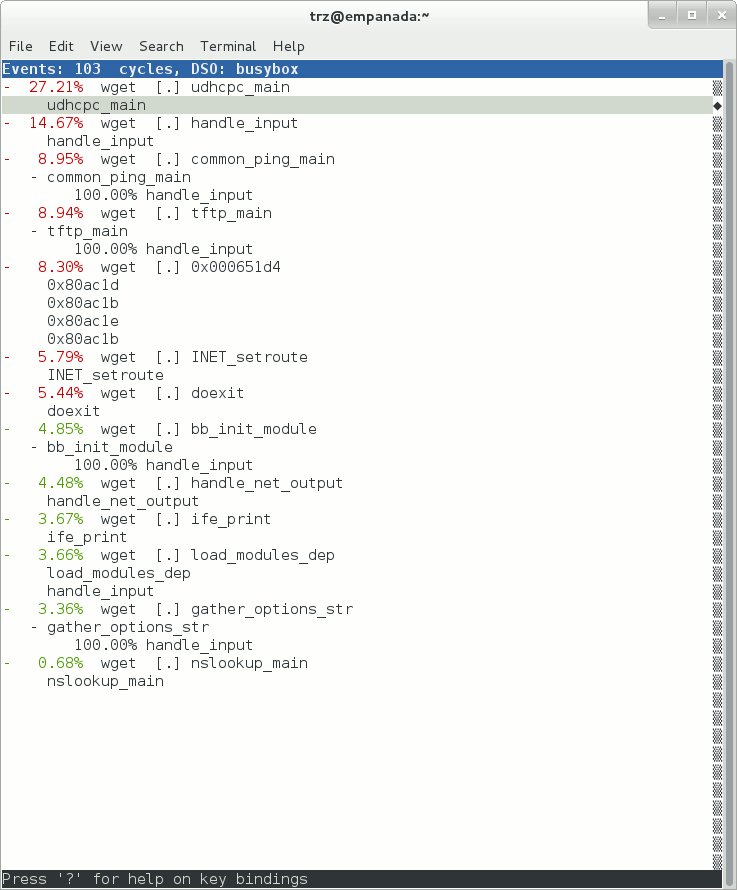
One of these actions allows us to show a view that displays a busybox-centric view of the profiled functions (in this case we've also expanded all the nodes using the 'E' key):
Finally, we can see that now that the busybox debuginfo is installed, the previously unresolved symbol in the sys_clock_gettime() entry mentioned previously is now resolved, and shows that the sys_clock_gettime system call that was the source of 6.75% of the copy-to-user overhead was initiated by the handle_input() busybox function:
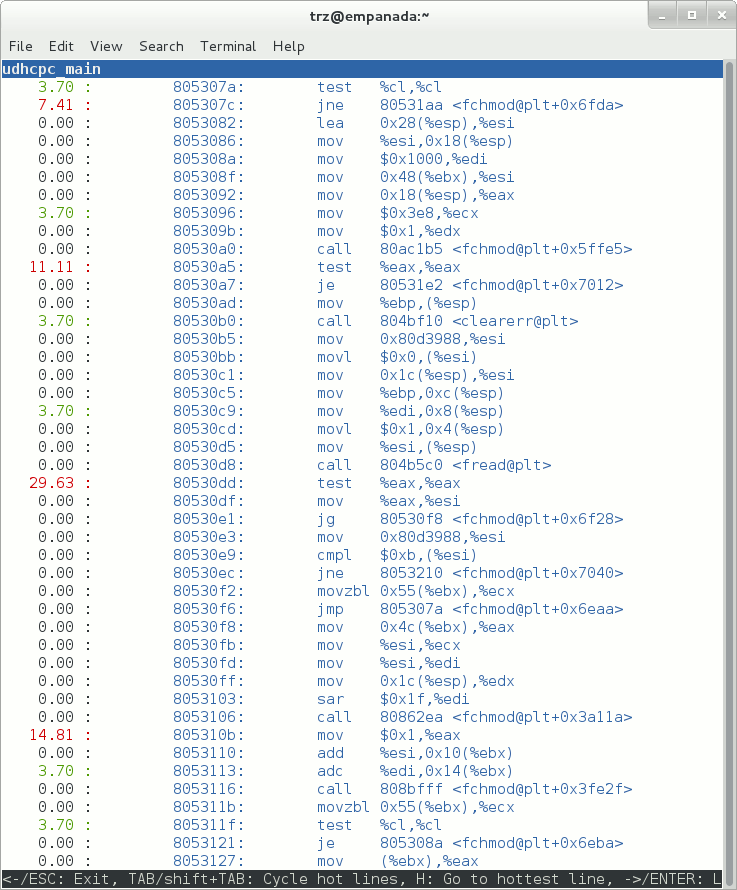
At the lowest level of detail, we can dive down to the assembly level and see which instructions caused the most overhead in a function. Pressing 'enter' on the 'udhcpc_main' function, we're again presented with a menu:
Selecting 'Annotate udhcpc_main', we get a detailed listing of percentages by instruction for the udhcpc_main function. From the display, we can see that over 50% of the time spent in this function is taken up by a couple tests and the move of a constant (1) to a register:
As a segue into tracing, let's try another profile using a different counter, something other than the default 'cycles'.
The tracing and profiling infrastructure in Linux has become unified in a way that allows us to use the same tool with a completely different set of counters, not just the standard hardware counters that traditionally tools have had to restrict themselves to (of course the traditional tools can also make use of the expanded possibilities now available to them, and in some cases have, as mentioned previously).
We can get a list of the available events that can be used to profile a workload via 'perf list':
root@crownbay:~# perf list

List of pre-defined events (to be used in -e):
 cpu-cycles OR cycles                               [Hardware event]
 stalled-cycles-frontend OR idle-cycles-frontend    [Hardware event]
 stalled-cycles-backend OR idle-cycles-backend      [Hardware event]
 instructions                                       [Hardware event]
 cache-references                                   [Hardware event]
 cache-misses                                       [Hardware event]
 branch-instructions OR branches                    [Hardware event]
 branch-misses                                      [Hardware event]
 bus-cycles                                         [Hardware event]
 ref-cycles                                         [Hardware event]

 cpu-clock                                          [Software event]
 task-clock                                         [Software event]
 page-faults OR faults                              [Software event]
 minor-faults                                       [Software event]
 major-faults                                       [Software event]
 context-switches OR cs                             [Software event]
 cpu-migrations OR migrations                       [Software event]
 alignment-faults                                   [Software event]
 emulation-faults                                   [Software event]

 L1-dcache-loads                                    [Hardware cache event]
 L1-dcache-load-misses                              [Hardware cache event]
 L1-dcache-prefetch-misses                          [Hardware cache event]
 L1-icache-loads                                    [Hardware cache event]
 L1-icache-load-misses                              [Hardware cache event]
 .
 .
 .
 rNNN                                               [Raw hardware event descriptor]
 cpu/t1=v1[,t2=v2,t3 ...]/modifier                  [Raw hardware event descriptor]
  (see 'perf list --help' on how to encode it)

 mem:<addr>[:access]                                [Hardware breakpoint]

 sunrpc:rpc_call_status                             [Tracepoint event]
 sunrpc:rpc_bind_status                             [Tracepoint event]
 sunrpc:rpc_connect_status                          [Tracepoint event]
 sunrpc:rpc_task_begin                              [Tracepoint event]
 skb:kfree_skb                                      [Tracepoint event]
 skb:consume_skb                                    [Tracepoint event]
 skb:skb_copy_datagram_iovec                        [Tracepoint event]
 net:net_dev_xmit                                   [Tracepoint event]
 net:net_dev_queue                                  [Tracepoint event]
 net:netif_receive_skb                              [Tracepoint event]
 net:netif_rx                                       [Tracepoint event]
 napi:napi_poll                                     [Tracepoint event]
 sock:sock_rcvqueue_full                            [Tracepoint event]
 sock:sock_exceed_buf_limit                         [Tracepoint event]
 udp:udp_fail_queue_rcv_skb                         [Tracepoint event]
 hda:hda_send_cmd                                   [Tracepoint event]
 hda:hda_get_response                               [Tracepoint event]
 hda:hda_bus_reset                                  [Tracepoint event]
 scsi:scsi_dispatch_cmd_start                       [Tracepoint event]
 scsi:scsi_dispatch_cmd_error                       [Tracepoint event]
 scsi:scsi_eh_wakeup                                [Tracepoint event]
 drm:drm_vblank_event                               [Tracepoint event]
 drm:drm_vblank_event_queued                        [Tracepoint event]
 drm:drm_vblank_event_delivered                     [Tracepoint event]
 random:mix_pool_bytes                              [Tracepoint event]
 random:mix_pool_bytes_nolock                       [Tracepoint event]
 random:credit_entropy_bits                         [Tracepoint event]
 gpio:gpio_direction                                [Tracepoint event]
 gpio:gpio_value                                    [Tracepoint event]
 block:block_rq_abort                               [Tracepoint event]
 block:block_rq_requeue                             [Tracepoint event]
 block:block_rq_issue                               [Tracepoint event]
 block:block_bio_bounce                             [Tracepoint event]
 block:block_bio_complete                           [Tracepoint event]
 block:block_bio_backmerge                          [Tracepoint event]
 .
 .
 writeback:writeback_wake_thread                    [Tracepoint event]
 writeback:writeback_wake_forker_thread             [Tracepoint event]
 writeback:writeback_bdi_register                   [Tracepoint event]
 .
 .
 writeback:writeback_single_inode_requeue           [Tracepoint event]
 writeback:writeback_single_inode                   [Tracepoint event]
 kmem:kmalloc                                       [Tracepoint event]
 kmem:kmem_cache_alloc                              [Tracepoint event]
 kmem:mm_page_alloc                                 [Tracepoint event]
 kmem:mm_page_alloc_zone_locked                     [Tracepoint event]
 kmem:mm_page_pcpu_drain                            [Tracepoint event]
 kmem:mm_page_alloc_extfrag                         [Tracepoint event]
 vmscan:mm_vmscan_kswapd_sleep                      [Tracepoint event]
 vmscan:mm_vmscan_kswapd_wake                       [Tracepoint event]
 vmscan:mm_vmscan_wakeup_kswapd                     [Tracepoint event]
 vmscan:mm_vmscan_direct_reclaim_begin              [Tracepoint event]
 .
 .
 module:module_get                                  [Tracepoint event]
 module:module_put                                  [Tracepoint event]
 module:module_request                              [Tracepoint event]
 sched:sched_kthread_stop                           [Tracepoint event]
 sched:sched_wakeup                                 [Tracepoint event]
 sched:sched_wakeup_new                             [Tracepoint event]
 sched:sched_process_fork                           [Tracepoint event]
 sched:sched_process_exec                           [Tracepoint event]
 sched:sched_stat_runtime                           [Tracepoint event]
 rcu:rcu_utilization                                [Tracepoint event]
 workqueue:workqueue_queue_work                     [Tracepoint event]
 workqueue:workqueue_execute_end                    [Tracepoint event]
 signal:signal_generate                             [Tracepoint event]
 signal:signal_deliver                              [Tracepoint event]
 timer:timer_init                                   [Tracepoint event]
 timer:timer_start                                  [Tracepoint event]
 timer:hrtimer_cancel                               [Tracepoint event]
 timer:itimer_state                                 [Tracepoint event]
 timer:itimer_expire                                [Tracepoint event]
 irq:irq_handler_entry                              [Tracepoint event]
 irq:irq_handler_exit                               [Tracepoint event]
 irq:softirq_entry                                  [Tracepoint event]
 irq:softirq_exit                                   [Tracepoint event]
 irq:softirq_raise                                  [Tracepoint event]
 printk:console                                     [Tracepoint event]
 task:task_newtask                                  [Tracepoint event]
 task:task_rename                                   [Tracepoint event]
 syscalls:sys_enter_socketcall                      [Tracepoint event]
 syscalls:sys_exit_socketcall                       [Tracepoint event]
 .
 .
 .
 syscalls:sys_enter_unshare                         [Tracepoint event]
 syscalls:sys_exit_unshare                          [Tracepoint event]
 raw_syscalls:sys_enter                             [Tracepoint event]
 raw_syscalls:sys_exit                              [Tracepoint event]
Tying It Together: These are exactly the same set of events defined by the trace event subsystem and
                   exposed by ftrace/tracecmd/kernelshark as files in /sys/kernel/debug/tracing/events,
                   by SystemTap as kernel.trace("tracepoint_name") and (partially) accessed by LTTng.
Only a subset of these would be of interest to us when looking at this workload, so let's choose the most likely subsystems (identified by the string before the colon in the Tracepoint events) and do a 'perf stat' run using only those wildcarded subsystems:
root@crownbay:~# perf stat -e skb:* -e net:* -e napi:* -e sched:* -e workqueue:* -e irq:* -e syscalls:* wget http://downloads.yoctoproject.org/mirror/sources/linux-2.6.19.2.tar.bz2
Performance counter stats for 'wget http://downloads.yoctoproject.org/mirror/sources/linux-2.6.19.2.tar.bz2':

            23323 skb:kfree_skb
                0 skb:consume_skb
            49897 skb:skb_copy_datagram_iovec
             6217 net:net_dev_xmit
             6217 net:net_dev_queue
             7962 net:netif_receive_skb
                2 net:netif_rx
             8340 napi:napi_poll
                0 sched:sched_kthread_stop
                0 sched:sched_kthread_stop_ret
             3749 sched:sched_wakeup
                0 sched:sched_wakeup_new
                0 sched:sched_switch
               29 sched:sched_migrate_task
                0 sched:sched_process_free
                1 sched:sched_process_exit
                0 sched:sched_wait_task
                0 sched:sched_process_wait
                0 sched:sched_process_fork
                1 sched:sched_process_exec
                0 sched:sched_stat_wait
    2106519415641 sched:sched_stat_sleep
                0 sched:sched_stat_iowait
        147453613 sched:sched_stat_blocked
      12903026955 sched:sched_stat_runtime
                0 sched:sched_pi_setprio
             3574 workqueue:workqueue_queue_work
             3574 workqueue:workqueue_activate_work
                0 workqueue:workqueue_execute_start
                0 workqueue:workqueue_execute_end
            16631 irq:irq_handler_entry
            16631 irq:irq_handler_exit
            28521 irq:softirq_entry
            28521 irq:softirq_exit
            28728 irq:softirq_raise
                1 syscalls:sys_enter_sendmmsg
                1 syscalls:sys_exit_sendmmsg
                0 syscalls:sys_enter_recvmmsg
                0 syscalls:sys_exit_recvmmsg
               14 syscalls:sys_enter_socketcall
               14 syscalls:sys_exit_socketcall
                  .
                  .
                  .
            16965 syscalls:sys_enter_read
            16965 syscalls:sys_exit_read
            12854 syscalls:sys_enter_write
            12854 syscalls:sys_exit_write
                  .
                  .
                  .

     58.029710972 seconds time elapsed
Let's pick one of these tracepoints and tell perf to do a profile using it as the sampling event:
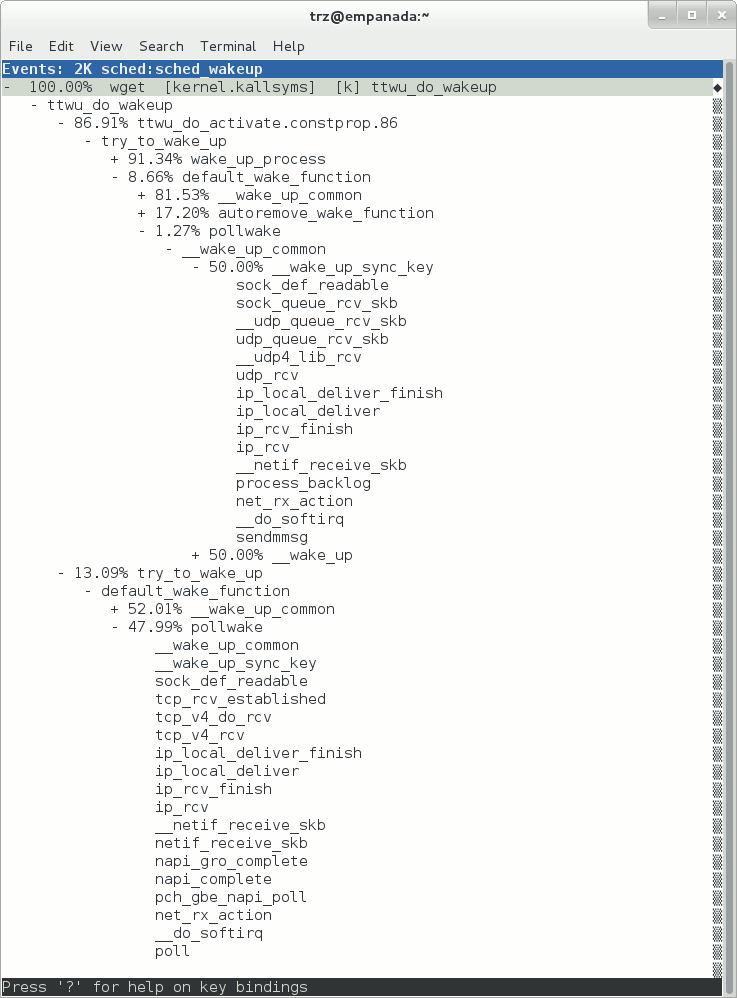
root@crownbay:~# perf record -g -e sched:sched_wakeup wget http://downloads.yoctoproject.org/mirror/sources/linux-2.6.19.2.tar.bz2
The screenshot above shows the results of running a profile using sched:sched_switch tracepoint, which shows the relative costs of various paths to sched_wakeup (note that sched_wakeup is the name of the tracepoint - it's actually defined just inside ttwu_do_wakeup(), which accounts for the function name actually displayed in the profile:
/*
 * Mark the task runnable and perform wakeup-preemption.
 */
static void
ttwu_do_wakeup(struct rq *rq, struct task_struct *p, int wake_flags)
{
 	trace_sched_wakeup(p, true);
        .
        .
        .
}
A couple of the more interesting callchains are expanded and displayed above, basically some network receive paths that presumably end up waking up wget (busybox) when network data is ready.
Note that because tracepoints are normally used for tracing, the default sampling period for tracepoints is 1 i.e. for tracepoints perf will sample on every event occurrence (this can be changed using the -c option). This is in contrast to hardware counters such as for example the default 'cycles' hardware counter used for normal profiling, where sampling periods are much higher (in the thousands) because profiling should have as low an overhead as possible and sampling on every cycle would be prohibitively expensive.
Using perf to do some basic tracing
Profiling is a great tool for solving many problems or for getting a high-level view of what's going on with a workload or across the system. It is however by definition an approximation, as suggested by the most prominent word associated with it, 'sampling'. On the one hand, it allows a representative picture of what's going on in the system to be cheaply taken, but on the other hand, that cheapness limits its utility when that data suggests a need to 'dive down' more deeply to discover what's really going on. In such cases, the only way to see what's really going on is to be able to look at (or summarize more intelligently) the individual steps that go into the higher-level behavior exposed by the coarse-grained profiling data.
As a concrete example, we can trace all the events we think might be applicable to our workload:
root@crownbay:~# perf record -g -e skb:* -e net:* -e napi:* -e sched:sched_switch -e sched:sched_wakeup -e irq:*
 -e syscalls:sys_enter_read -e syscalls:sys_exit_read -e syscalls:sys_enter_write -e syscalls:sys_exit_write
 wget http://downloads.yoctoproject.org/mirror/sources/linux-2.6.19.2.tar.bz2
We can look at the raw trace output using 'perf script' with no arguments:
root@crownbay:~# perf script
           perf  1262 [000] 11624.857082: sys_exit_read: 0x0
           perf  1262 [000] 11624.857193: sched_wakeup: comm=migration/0 pid=6 prio=0 success=1 target_cpu=000
           wget  1262 [001] 11624.858021: softirq_raise: vec=1 [action=TIMER]
           wget  1262 [001] 11624.858074: softirq_entry: vec=1 [action=TIMER]
           wget  1262 [001] 11624.858081: softirq_exit: vec=1 [action=TIMER]
           wget  1262 [001] 11624.858166: sys_enter_read: fd: 0x0003, buf: 0xbf82c940, count: 0x0200
           wget  1262 [001] 11624.858177: sys_exit_read: 0x200
           wget  1262 [001] 11624.858878: kfree_skb: skbaddr=0xeb248d80 protocol=0 location=0xc15a5308
           wget  1262 [001] 11624.858945: kfree_skb: skbaddr=0xeb248000 protocol=0 location=0xc15a5308
           wget  1262 [001] 11624.859020: softirq_raise: vec=1 [action=TIMER]
           wget  1262 [001] 11624.859076: softirq_entry: vec=1 [action=TIMER]
           wget  1262 [001] 11624.859083: softirq_exit: vec=1 [action=TIMER]
           wget  1262 [001] 11624.859167: sys_enter_read: fd: 0x0003, buf: 0xb7720000, count: 0x0400
           wget  1262 [001] 11624.859192: sys_exit_read: 0x1d7
           wget  1262 [001] 11624.859228: sys_enter_read: fd: 0x0003, buf: 0xb7720000, count: 0x0400
           wget  1262 [001] 11624.859233: sys_exit_read: 0x0
           wget  1262 [001] 11624.859573: sys_enter_read: fd: 0x0003, buf: 0xbf82c580, count: 0x0200
           wget  1262 [001] 11624.859584: sys_exit_read: 0x200
           wget  1262 [001] 11624.859864: sys_enter_read: fd: 0x0003, buf: 0xb7720000, count: 0x0400
           wget  1262 [001] 11624.859888: sys_exit_read: 0x400
           wget  1262 [001] 11624.859935: sys_enter_read: fd: 0x0003, buf: 0xb7720000, count: 0x0400
           wget  1262 [001] 11624.859944: sys_exit_read: 0x400
This gives us a detailed timestamped sequence of events that occurred within the workload with respect to those events.
In many ways, profiling can be viewed as a subset of tracing - theoretically, if you have a set of trace events that's sufficient to capture all the important aspects of a workload, you can derive any of the results or views that a profiling run can.
Another aspect of traditional profiling is that while powerful in many ways, it's limited by the granularity of the underlying data. Profiling tools offer various ways of sorting and presenting the sample data, which make it much more useful and amenable to user experimentation, but in the end it can't be used in an open-ended way to extract data that just isn't present as a consequence of the fact that conceptually, most of it has been thrown away.
Full-blown detailed tracing data does however offer the opportunity to manipulate and present the information collected during a tracing run in an infinite variety of ways.
Another way to look at it is that there are only so many ways that the 'primitive' counters can be used on their own to generate interesting output; to get anything more complicated than simple counts requires some amount of additional logic, which is typically very specific to the problem at hand. For example, if we wanted to make use of a 'counter' that maps to the value of the time difference between when a process was scheduled to run on a processor and the time it actually ran, we wouldn't expect such a counter to exist on its own, but we could derive one called say 'wakeup_latency' and use it to extract a useful view of that metric from trace data. Likewise, we really can't figure out from standard profiling tools how much data every process on the system reads and writes, along with how many of those reads and writes fail completely. If we have sufficient trace data, however, we could with the right tools easily extract and present that information, but we'd need something other than pre-canned profiling tools to do that.
Luckily, there is general-purpose way to handle such needs, called 'programming languages'. Making programming languages easily available to apply to such problems given the specific format of data is called a 'programming language binding' for that data and language. Perf supports two programming language bindings, one for Python and one for Perl.
Tying It Together: Language bindings for manipulating and aggregating trace data are of course not a new
                   idea.  One of the first projects to do this was IBM's DProbes dpcc compiler, an ANSI C
                   compiler which targeted a low-level assembly language running on an in-kernel interpreter
                   on the target system.  This is exactly analagous to what Sun's DTrace did, except that DTrace
                   invented its own language for the purpose.  Systemtap, heavily inspired by DTrace, also
                   created its own one-off language, but rather than running the product on an in-kernel
                   interpreter, created an elaborate compiler-based machinery to translate its language into
                   kernel modules written in C.
Now that we have the trace data in perf.data, we can use 'perf script -g' to generate a skeleton script with handlers for the read/write entry/exit events we recorded:
root@crownbay:~# perf script -g python
generated Python script: perf-script.py
The skeleton script simply creates a python function for each event type in the perf.data file. The body of each function simply prints the event name along with its parameters. For example:
def net__netif_rx(event_name, context, common_cpu,
       common_secs, common_nsecs, common_pid, common_comm,
       skbaddr, len, name):
               print_header(event_name, common_cpu, common_secs, common_nsecs,
                       common_pid, common_comm)

		print "skbaddr=%u, len=%u, name=%s\n" % (skbaddr, len, name),
We can run that script directly to print all of the events contained in the perf.data file:
root@crownbay:~# perf script -s perf-script.py

in trace_begin
syscalls__sys_exit_read     0 11624.857082795     1262 perf                  nr=3, ret=0
sched__sched_wakeup      0 11624.857193498     1262 perf                  comm=migration/0, pid=6, prio=0, success=1, target_cpu=0
irq__softirq_raise       1 11624.858021635     1262 wget                  vec=TIMER
irq__softirq_entry       1 11624.858074075     1262 wget                  vec=TIMER
irq__softirq_exit        1 11624.858081389     1262 wget                  vec=TIMER
syscalls__sys_enter_read     1 11624.858166434     1262 wget                  nr=3, fd=3, buf=3213019456, count=512
syscalls__sys_exit_read     1 11624.858177924     1262 wget                  nr=3, ret=512
skb__kfree_skb           1 11624.858878188     1262 wget                  skbaddr=3945041280, location=3243922184, protocol=0
skb__kfree_skb           1 11624.858945608     1262 wget                  skbaddr=3945037824, location=3243922184, protocol=0
irq__softirq_raise       1 11624.859020942     1262 wget                  vec=TIMER
irq__softirq_entry       1 11624.859076935     1262 wget                  vec=TIMER
irq__softirq_exit        1 11624.859083469     1262 wget                  vec=TIMER
syscalls__sys_enter_read     1 11624.859167565     1262 wget                  nr=3, fd=3, buf=3077701632, count=1024
syscalls__sys_exit_read     1 11624.859192533     1262 wget                  nr=3, ret=471
syscalls__sys_enter_read     1 11624.859228072     1262 wget                  nr=3, fd=3, buf=3077701632, count=1024
syscalls__sys_exit_read     1 11624.859233707     1262 wget                  nr=3, ret=0
syscalls__sys_enter_read     1 11624.859573008     1262 wget                  nr=3, fd=3, buf=3213018496, count=512
syscalls__sys_exit_read     1 11624.859584818     1262 wget                  nr=3, ret=512
syscalls__sys_enter_read     1 11624.859864562     1262 wget                  nr=3, fd=3, buf=3077701632, count=1024
syscalls__sys_exit_read     1 11624.859888770     1262 wget                  nr=3, ret=1024
syscalls__sys_enter_read     1 11624.859935140     1262 wget                  nr=3, fd=3, buf=3077701632, count=1024
syscalls__sys_exit_read     1 11624.859944032     1262 wget                  nr=3, ret=1024
That in itself isn't very useful; after all, we can accomplish pretty much the same thing by simply running 'perf script' without arguments in the same directory as the perf.data file.
We can however replace the print statements in the generated function bodies with whatever we want, and thereby make it infinitely more useful.
As a simple example, let's just replace the print statements in the function bodies with a simple function that does nothing but increment a per-event count. When the program is run against a perf.data file, each time a particular event is encountered, a tally is incremented for that event. For example:
def net__netif_rx(event_name, context, common_cpu,
       common_secs, common_nsecs, common_pid, common_comm,
       skbaddr, len, name):
		inc_counts(event_name)
Each event handler function in the generated code is modified to do this. For convenience, we define a common function called inc_counts() that each handler calls; inc_counts simply tallies a count for each event using the 'counts' hash, which is a specialized has function that does Perl-like autovivification, a capability that's extremely useful for kinds of multi-level aggregation commonly used in processing traces (see perf's documentation on the Python language binding for details):
counts = autodict()
def inc_counts(event_name):
       try:
               counts[event_name] += 1
       except TypeError:
               counts[event_name] = 1
Finally, at the end of the trace processing run, we want to print the result of all the per-event tallies. For that, we use the special 'trace_end()' function:
def trace_end():
       for event_name, count in counts.iteritems():
               print "%-40s %10s\n" % (event_name, count)
The end result is a summary of all the events recorded in the trace:
skb__skb_copy_datagram_iovec                  13148
irq__softirq_entry                             4796
irq__irq_handler_exit                          3805
irq__softirq_exit                              4795
syscalls__sys_enter_write                      8990
net__net_dev_xmit                               652
skb__kfree_skb                                 4047
sched__sched_wakeup                            1155
irq__irq_handler_entry                         3804
irq__softirq_raise                             4799
net__net_dev_queue                              652
syscalls__sys_enter_read                      17599
net__netif_receive_skb                         1743
syscalls__sys_exit_read                       17598
net__netif_rx                                     2
napi__napi_poll                                1877
syscalls__sys_exit_write                       8990
Note that this is pretty much exactly the same information we get from 'perf stat', which goes a little way to support the idea mentioned previously that given the right kind of trace data, higher-level profiling-type summaries can be derived from it.
Documentation on using the 'perf script' python binding
System-wide tracing and profiling (and filtering)
The examples so far have focused on tracing a particular program or workload - in other words, every profiling run has specified the program to profile in the command-line e.g. 'perf record wget ...'.
It's also possible, and more interesting in many cases, to run a system-wide profile or trace while running the workload in a separate shell.
To do system-wide profiling or tracing, you typically use the -a flag to 'perf record'.
To demonstrate this, open up one window and start the profile using the -a flag (press Ctrl-C to stop tracing):
root@crownbay:~# perf record -g -a
^C[ perf record: Woken up 6 times to write data ]
[ perf record: Captured and wrote 1.400 MB perf.data (~61172 samples) ]
In another window, run the wget test:
root@crownbay:~# wget http://downloads.yoctoproject.org/mirror/sources/linux-2.6.19.2.tar.bz2
Connecting to downloads.yoctoproject.org (140.211.169.59:80)
linux-2.6.19.2.tar.b 100% |*******************************| 41727k  0:00:00 ETA
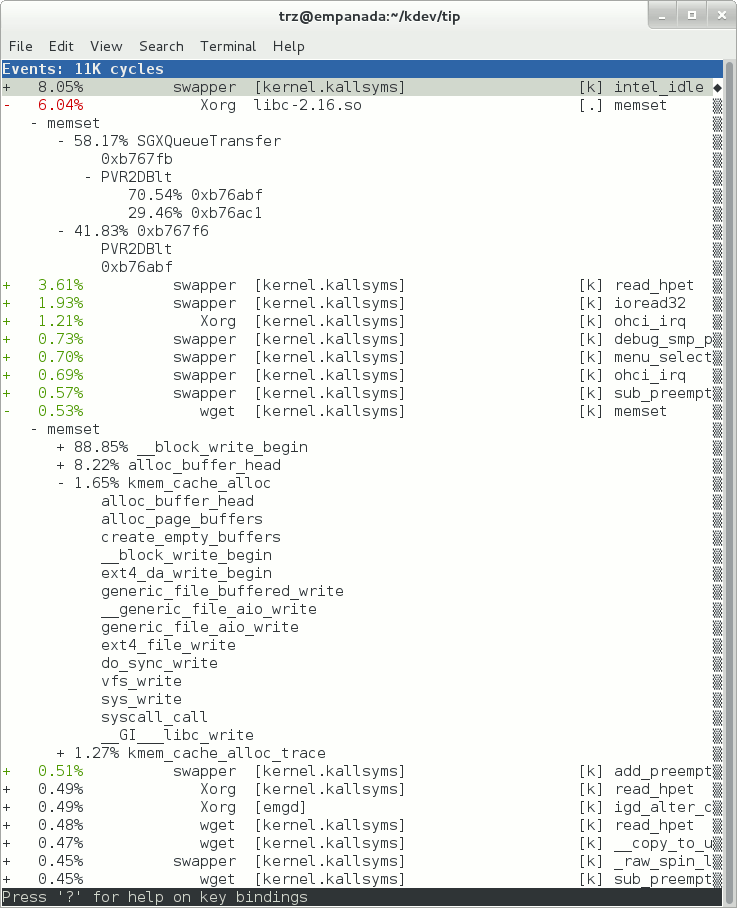
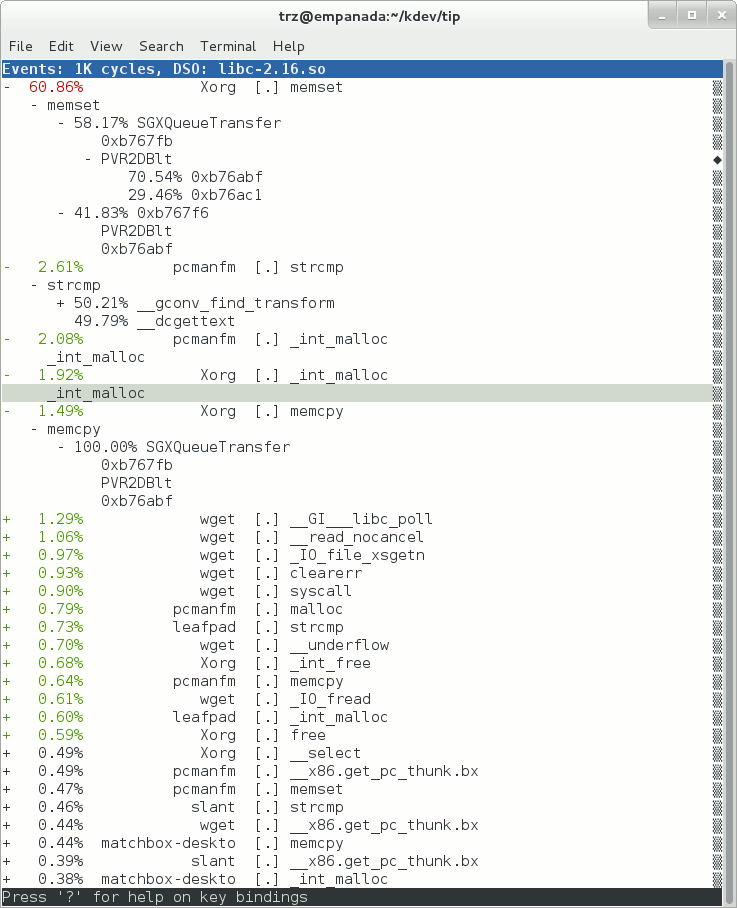
Here we see entries not only for our wget load, but for other processes running on the system as well:
In the snapshot above, we can see callchains that originate in libc, and a callchain from Xorg that demonstrates that we're using a proprietary X driver in userspace (notice the presence of 'PVR' and some other unresolvable symbols in the expanded Xorg callchain).
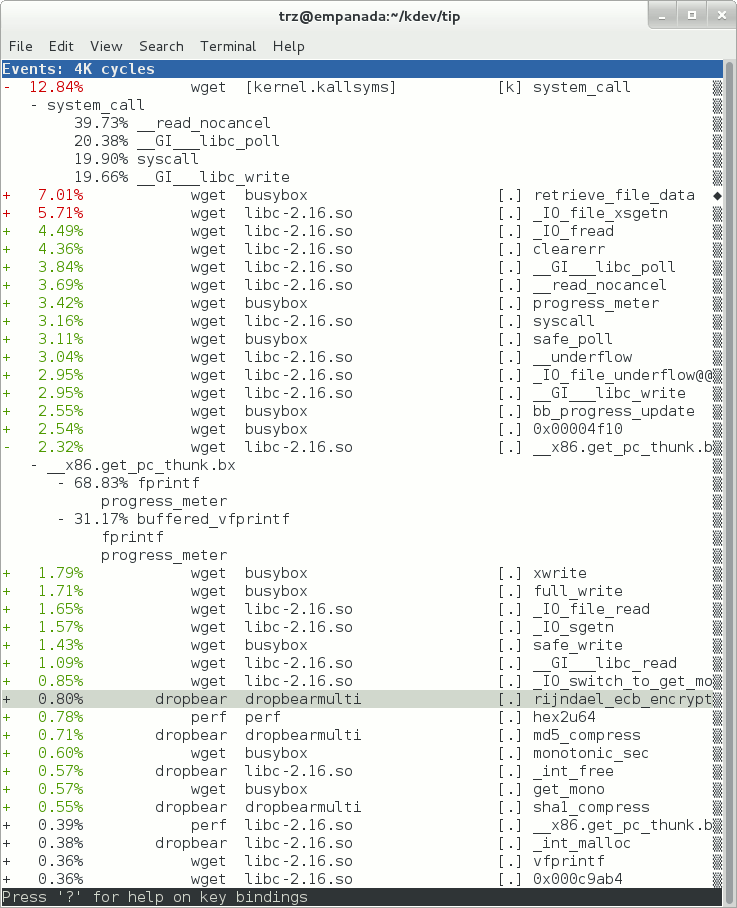
Note also that we have both kernel and userspace entries in the above snapshot. We can also tell perf to focus on userspace but providing a modifier, in this case 'u', to the 'cycles' hardware counter when we record a profile:
root@crownbay:~# perf record -g -a -e cycles:u
^C[ perf record: Woken up 2 times to write data ]
[ perf record: Captured and wrote 0.376 MB perf.data (~16443 samples) ]
Notice in the screenshot above, we see only userspace entries ([.])
Finally, we can press 'enter' on a leaf node and select the 'Zoom into DSO' menu item to show only entries associated with a specific DSO. In the screenshot below, we've zoomed into the 'libc' DSO which shows all the entries associated with the libc-xxx.so DSO.
We can also use the system-wide -a switch to do system-wide tracing. Here we'll trace a couple of scheduler events:
root@crownbay:~# perf record -a -e sched:sched_switch -e sched:sched_wakeup
^C[ perf record: Woken up 38 times to write data ]
[ perf record: Captured and wrote 9.780 MB perf.data (~427299 samples) ]
We can look at the raw output using 'perf script' with no arguments:
root@crownbay:~# perf script

           perf  1383 [001]  6171.460045: sched_wakeup: comm=kworker/1:1 pid=21 prio=120 success=1 target_cpu=001
           perf  1383 [001]  6171.460066: sched_switch: prev_comm=perf prev_pid=1383 prev_prio=120 prev_state=R+ ==> next_comm=kworker/1:1 next_pid=21 next_prio=120
    kworker/1:1    21 [001]  6171.460093: sched_switch: prev_comm=kworker/1:1 prev_pid=21 prev_prio=120 prev_state=S ==> next_comm=perf next_pid=1383 next_prio=120
        swapper     0 [000]  6171.468063: sched_wakeup: comm=kworker/0:3 pid=1209 prio=120 success=1 target_cpu=000
        swapper     0 [000]  6171.468107: sched_switch: prev_comm=swapper/0 prev_pid=0 prev_prio=120 prev_state=R ==> next_comm=kworker/0:3 next_pid=1209 next_prio=120
    kworker/0:3  1209 [000]  6171.468143: sched_switch: prev_comm=kworker/0:3 prev_pid=1209 prev_prio=120 prev_state=S ==> next_comm=swapper/0 next_pid=0 next_prio=120
           perf  1383 [001]  6171.470039: sched_wakeup: comm=kworker/1:1 pid=21 prio=120 success=1 target_cpu=001
           perf  1383 [001]  6171.470058: sched_switch: prev_comm=perf prev_pid=1383 prev_prio=120 prev_state=R+ ==> next_comm=kworker/1:1 next_pid=21 next_prio=120
    kworker/1:1    21 [001]  6171.470082: sched_switch: prev_comm=kworker/1:1 prev_pid=21 prev_prio=120 prev_state=S ==> next_comm=perf next_pid=1383 next_prio=120
           perf  1383 [001]  6171.480035: sched_wakeup: comm=kworker/1:1 pid=21 prio=120 success=1 target_cpu=001
Notice that there are a lot of events that don't really have anything to do with what we're interested in, namely events that schedule 'perf' itself in and out or that wake perf up. We can get rid of those by using the '--filter' option - for each event we specify using -e, we can add a --filter after that to filter out trace events that contain fields with specific values:
root@crownbay:~# perf record -a -e sched:sched_switch --filter 'next_comm != perf && prev_comm != perf' -e sched:sched_wakeup --filter 'comm != perf'
^C[ perf record: Woken up 38 times to write data ]
[ perf record: Captured and wrote 9.688 MB perf.data (~423279 samples) ]
root@crownbay:~# perf script

        swapper     0 [000]  7932.162180: sched_switch: prev_comm=swapper/0 prev_pid=0 prev_prio=120 prev_state=R ==> next_comm=kworker/0:3 next_pid=1209 next_prio=120
    kworker/0:3  1209 [000]  7932.162236: sched_switch: prev_comm=kworker/0:3 prev_pid=1209 prev_prio=120 prev_state=S ==> next_comm=swapper/0 next_pid=0 next_prio=120
           perf  1407 [001]  7932.170048: sched_wakeup: comm=kworker/1:1 pid=21 prio=120 success=1 target_cpu=001
           perf  1407 [001]  7932.180044: sched_wakeup: comm=kworker/1:1 pid=21 prio=120 success=1 target_cpu=001
           perf  1407 [001]  7932.190038: sched_wakeup: comm=kworker/1:1 pid=21 prio=120 success=1 target_cpu=001
           perf  1407 [001]  7932.200044: sched_wakeup: comm=kworker/1:1 pid=21 prio=120 success=1 target_cpu=001
           perf  1407 [001]  7932.210044: sched_wakeup: comm=kworker/1:1 pid=21 prio=120 success=1 target_cpu=001
           perf  1407 [001]  7932.220044: sched_wakeup: comm=kworker/1:1 pid=21 prio=120 success=1 target_cpu=001
        swapper     0 [001]  7932.230111: sched_wakeup: comm=kworker/1:1 pid=21 prio=120 success=1 target_cpu=001
        swapper     0 [001]  7932.230146: sched_switch: prev_comm=swapper/1 prev_pid=0 prev_prio=120 prev_state=R ==> next_comm=kworker/1:1 next_pid=21 next_prio=120
    kworker/1:1    21 [001]  7932.230205: sched_switch: prev_comm=kworker/1:1 prev_pid=21 prev_prio=120 prev_state=S ==> next_comm=swapper/1 next_pid=0 next_prio=120
        swapper     0 [000]  7932.326109: sched_wakeup: comm=kworker/0:3 pid=1209 prio=120 success=1 target_cpu=000
        swapper     0 [000]  7932.326171: sched_switch: prev_comm=swapper/0 prev_pid=0 prev_prio=120 prev_state=R ==> next_comm=kworker/0:3 next_pid=1209 next_prio=120
    kworker/0:3  1209 [000]  7932.326214: sched_switch: prev_comm=kworker/0:3 prev_pid=1209 prev_prio=120 prev_state=S ==> next_comm=swapper/0 next_pid=0 next_prio=120
In this case, we've filtered out all events that have 'perf' in their 'comm' or 'comm_prev' or 'comm_next' fields. Notice that there are still events recorded for perf, but notice that those events don't have values of 'perf' for the filtered fields. To completely filter out anything from perf will require a bit more work, but for the purpose of demonstrating how to use filters, it's close enough.
Tying It Together: These are exactly the same set of event filters defined by the trace event subsystem. See
                   the ftrace/tracecmd/kernelshark section for more discussion about these event filters.
Tying It Together: These event filters are implemented by a special-purpose pseudo-interpreter in the kernel
                    and are an integral and indispensable part of the perf design as it relates to tracing.  kernel-
                    based event filters provide a mechanism to precisely throttle the event stream that appears
                    in user space, where it makes sense to provide bindings to real programming languages for
                    postprocessing the event stream.  This architecture allows for the intelligent and flexible
                    partitioning of processing between the kernel and user space.  Contrast this with other tools
                    such as SystemTap, which does all of its processing in the kernel and as such requires a special
                    project-defined language in order to accommodate that design, or LTTng, where everything is sent
                    to userspace and as such requires a super-efficient kernel-to-userspace transport mechanism in
                    order to function properly.  While perf certainly can benefit from for instance advances in
                    the design of the transport, it doesn't fundamentally depend on them.  Basically, if you find
                    that your perf tracing application is causing buffer I/O overruns, it probably means that you
                    aren't taking enough advantage of the kernel filtering engine.
ftrace
Documentation/trace/events.txt
trace-cmd/kernelshark
oprofile
Oprofile as configured in Yocto is a system-wide profiler (i.e. the version in Yocto doesn't yet make use of the perf_events interface which would allow it to profile specific processes and workloads.
[trz@empanada tmp]$ git clone git://git.yoctoproject.org/oprofileui
[trz@empanada tmp]$ cd oprofileui
[trz@empanada oprofileui]$ ./autogen.sh
[trz@empanada oprofileui]$ sudo make install
Check if vmlinux file: is set:
root@crownbay:~# opcontrol --status
If not:
root@crownbay:~# opcontrol --shutdown
root@crownbay:~# opcontrol --vmlinux=/boot/vmlinux-`uname -r`
root@crownbay:~# opcontrol --start-daemon
The oprofile server should automatically be started already. If not:
root@crownbay:~# oprofile-server
root@crownbay:~# oprofile-server --port 8888
root@crownbay:~# opcontrol --deinit; opcontrol --status
root@crownbay:~# opcontrol --vmlinux=/boot/vmlinux-`uname -r`
root@crownbay:~# opcontrol --init; opcontrol --status
root@crownbay:~# opcontrol --shutdown
root@crownbay:~# oprofile-server
[trz@empanada oprofileui]$ oprofile-viewer
To run a profile on the remote system, first connect to the remote system by pressing the 'Connect' button and supplying the IP address and port of the remote system (the default port is 4224). Once connected, press the 'Start' button and then run the wget workload on the remote system:
root@crownbay:/media/sdc# rm linux-2.6.19.2.tar.bz2; wget http://downloads.yoctoproject.org/mirror/sources/linux-2.6.19.2.tar.bz2; sync
Connecting to downloads.yoctoproject.org (140.211.169.59:80)
linux-2.6.19.2.tar.b 100% |*******************************| 41727k  0:00:00 ETA
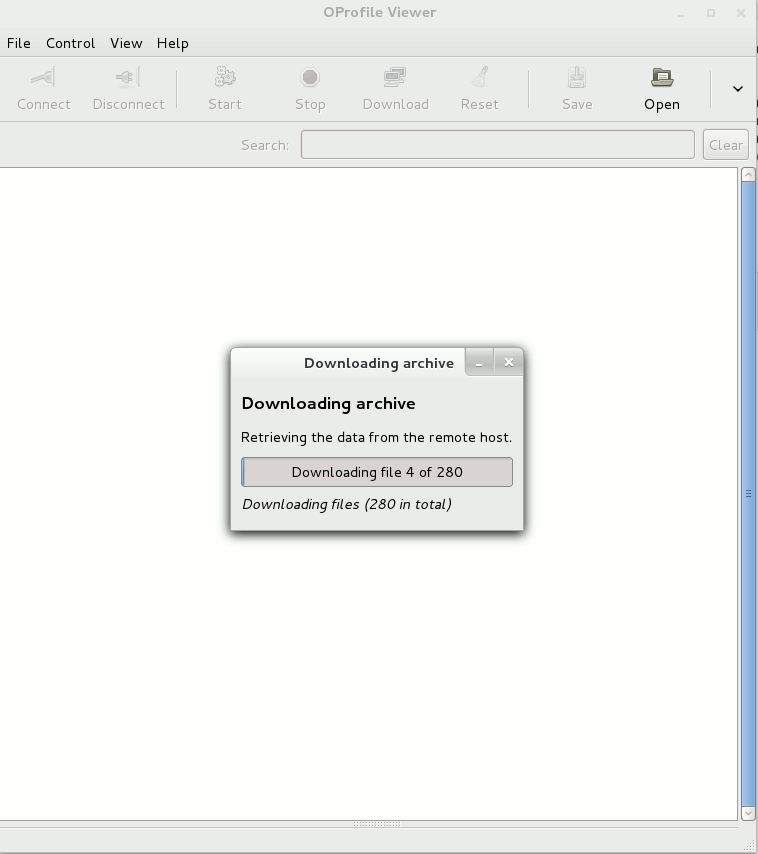
Once the workload completes, press the 'Stop' button. At that point the OProfile viewer will download the profile files it's collected (this may take some time, especially if the kernel was profiled). While it downloads the files, you should see something like the following:
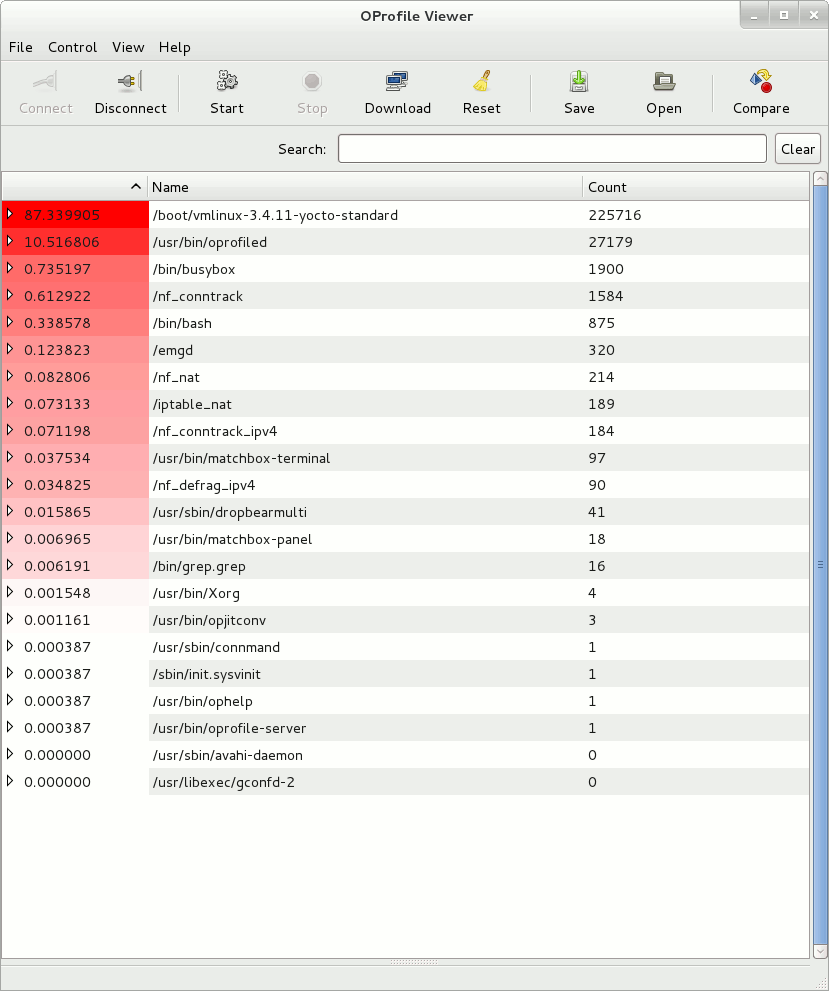
Once the profile files have been retrieved, you should see a list of the processes that were profiled:
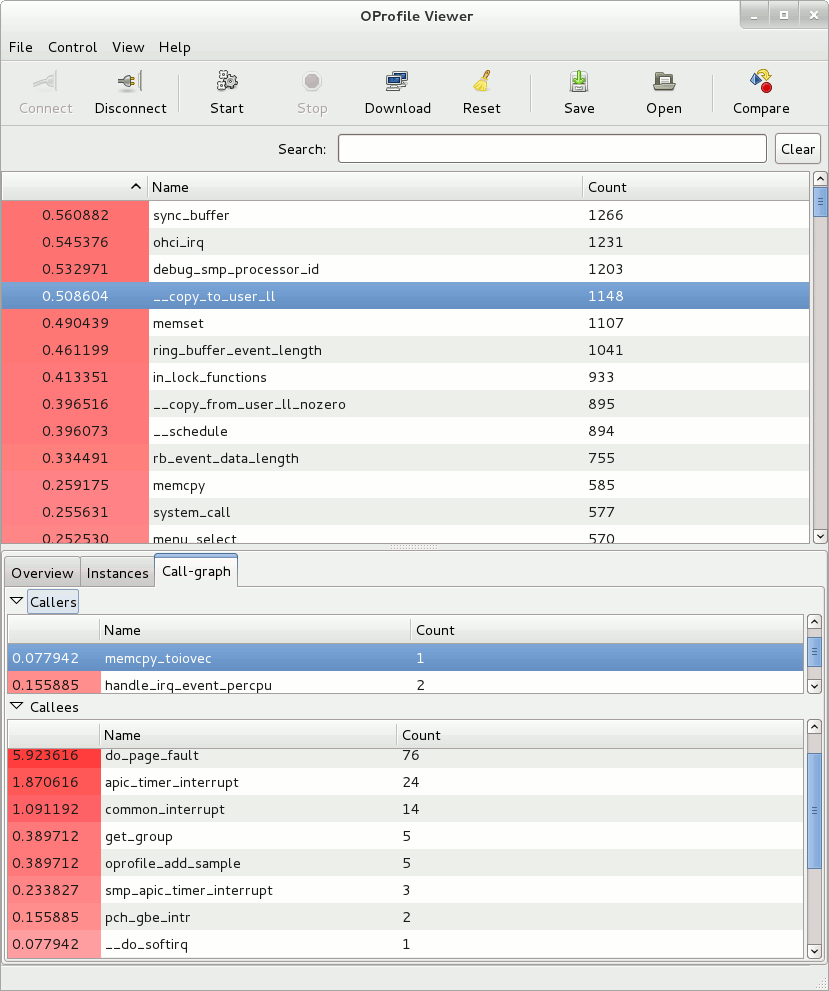
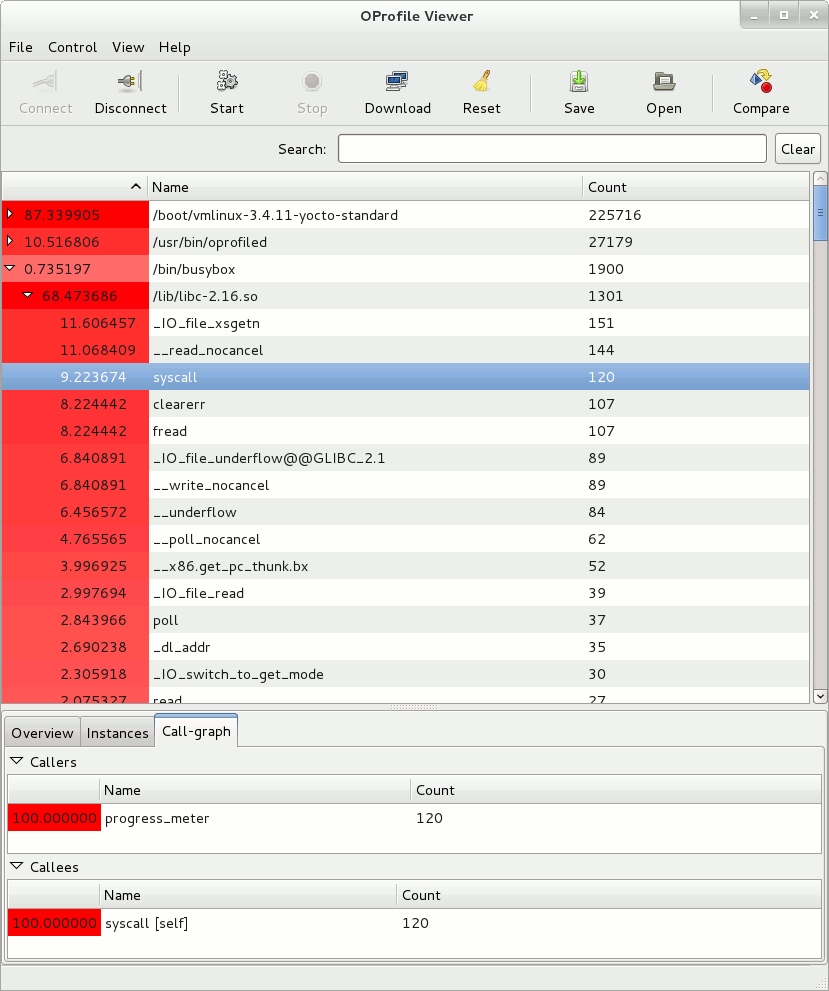
If you select one of them, you should see all the symbols that were hit during the profile. Selecting one of them will show a list of callers and callees of the chosen function in two panes below the top pane. For example, here's what we see when we select __copy_to_user_ll():
As another example, we can look at the busybox process and see that the progress meter made a system call:
Tying It Together: oprofile does have build options to enable use of the perf_event subsystem and
                   benefit from the perf_event infrastructure by adding support for something other than
                   system-wide profiling i.e. per-process or workload profiling, but the version in danny
                   doesn't yet take advantage of those capabilities.
Documentation
Yocto already has some information on setting up and using OProfile and oprofileui. As this document doesn't cover everything in detail, it may be worth taking a look: Yocto Project Development Manual - Profiling with OProfile
The OProfile manual can be found here: OProfile manual
The OProfile website contains links to the above manual and bunch of other items including an extensive set of examples: About OProfile
Sysprof
Sysprof is a very easy to use system-wide profiler that consists of a single window with three panes and a few buttons which allow you to start, stop, and view the profile from one place.
To start profiling the system, you simply press the 'Start' button. To stop profiling and to start viewing the profile data in one easy step, press the 'Profile' button.
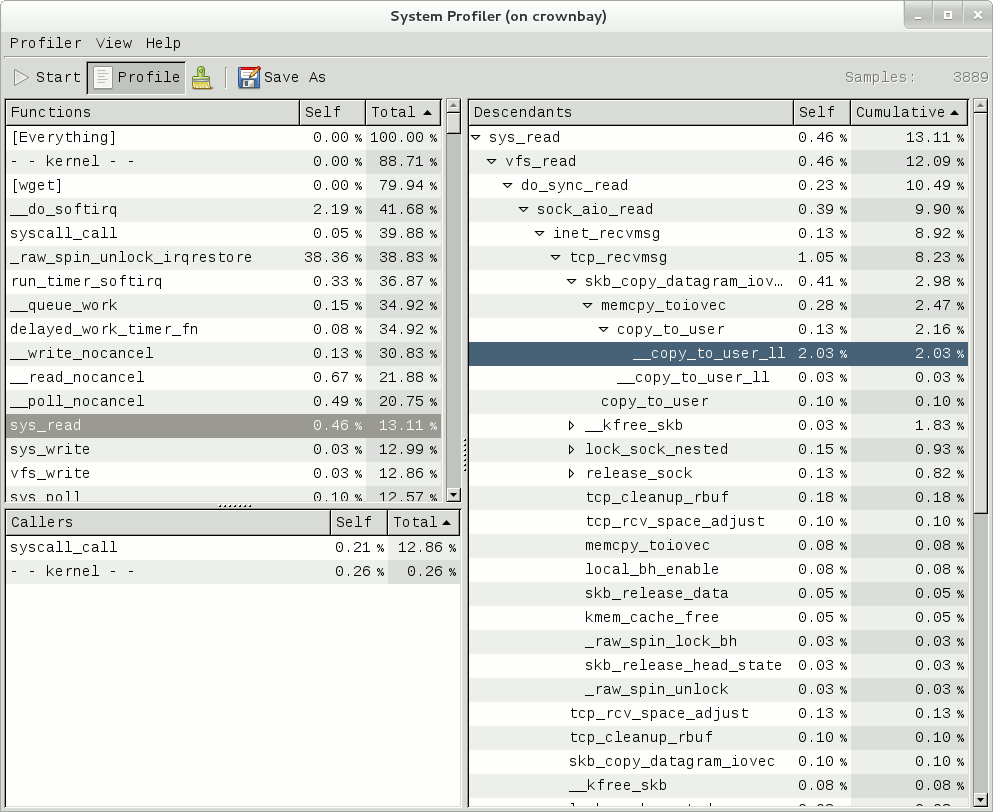
Once you've pressed the profile button, the three panes will fill up with profiling data:
The left pane shows a list of functions and processes. Selecting one of those expands that function in the right pane, showing all its callees. Note that this caller-oriented display is essentially the inverse of perf's default callee-oriented callchain display.
In the screenshot above, we're focusing on __copy_to_user_ll() and looking up the callchain we can see that one of the callers of __copy_to_user_ll is sys_read() and the complete callpath between them. Notice that this is essentially a portion of the same information we saw in the perf display shown in the perf section of this page.
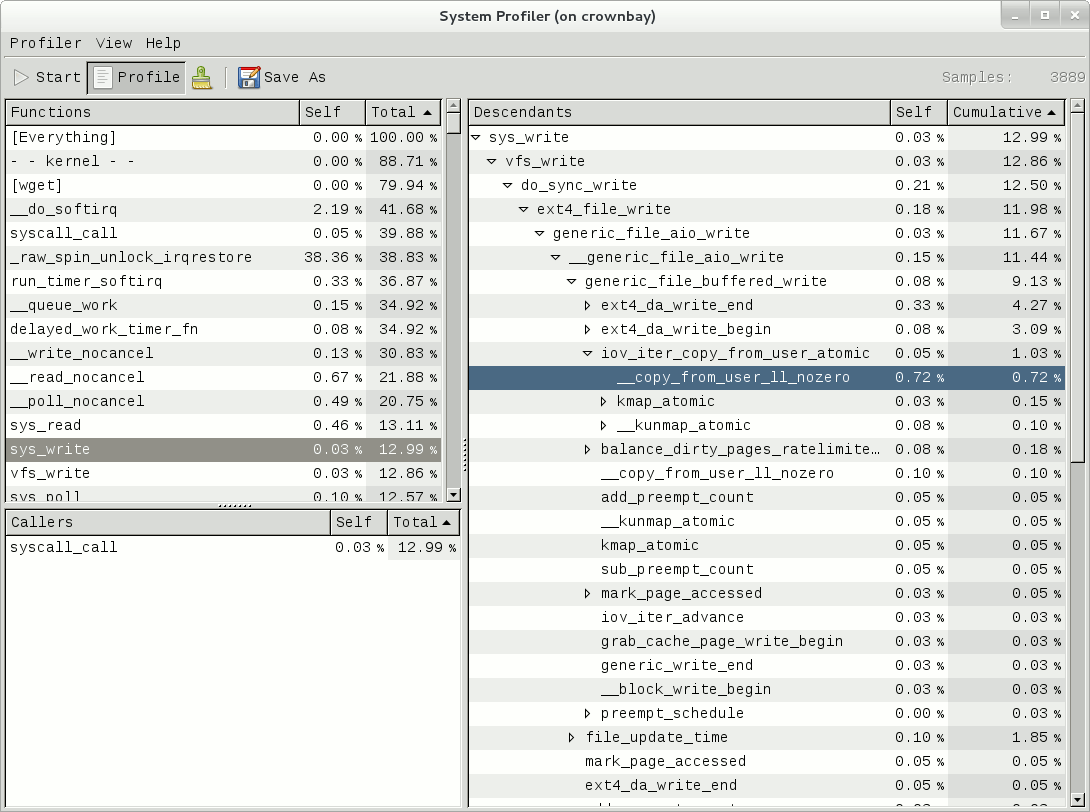
Similarly, the above is a snapshot of the Sysprof display of a copy-from-user callchain.
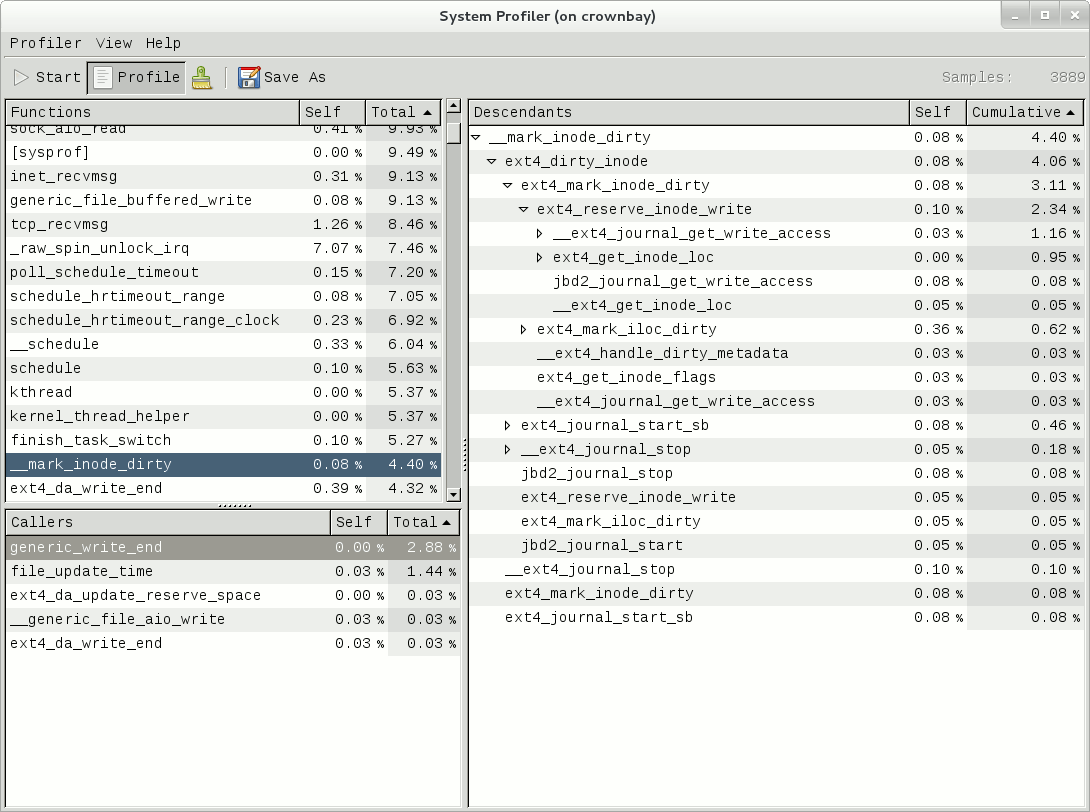
Finally, looking at the third Sysprof pane in the lower left, we can see a list of all the callers of a particular function selected in the top left pane. In this case, the lower pane is showing all the callers of __mark_inode_dirty:
Double-clicking on one of those functions will in turn change the focus to the selected function, and so on.
Tying It Together: If you like sysprof's 'caller-oriented' display, you may be able to approximate
                   it in other tools as well.  For example, 'perf report' has the -g (--call-graph) option
                   that you can experiment with; one of the options is 'caller' for an inverted caller-based
                   callgraph display.
Tying It Together: sysprof does have build options to enable use of the perf_event subsystem and
                   benefit from the perf_event infrastructure by adding support for something other than
                   system-wide profiling i.e. per-process or workload profiling, but the version in danny
                   doesn't yet take advantage of those capabilities (sysprof officially added the ability.
                   to make use of perf_events just as we were going to press).
Documentation
There doesn't seem to be any documentation for Sysprof, but maybe that's because it's pretty self-explanatory. The Sysprof website, however, is here:
Sysprof, System-wide Performance Profiler for Linux
LTTng (Linux Trace Toolkit, next generation)
Setup
NOTE: The lttng support in Yocto 1.3 (danny) needs the following poky commits applied in order to work:
- http://git.yoctoproject.org/cgit/cgit.cgi/poky-contrib/commit/?h=tzanussi/switch-to-lttng2&id=ea602300d9211669df0acc5c346e4486d6bf6f67
- http://git.yoctoproject.org/cgit/cgit.cgi/poky-contrib/commit/?h=tzanussi/lttng-fixes.0&id=1d0dc88e1635cfc24612a3e97d0391facdc2c65f
If you also want to view the LTTng traces graphically, you also need to download and install/run the 'SR1' or later Juno release of eclipse e.g.:
Collecting and Viewing Traces
Once you've applied the above commits and built and booted your image (you need to build the core-image-sato-sdk image or the other methods described in the General Setup section), you're ready to start tracing.
Collecting and viewing a trace on the target (inside a shell)
First, from the target, ssh to the target:
$ ssh -l root 192.168.1.47
The authenticity of host '192.168.1.47 (192.168.1.47)' can't be established.
RSA key fingerprint is 23:bd:c8:b1:a8:71:52:00:ee:00:4f:64:9e:10:b9:7e.
Are you sure you want to continue connecting (yes/no)? yes
Warning: Permanently added '192.168.1.47' (RSA) to the list of known hosts.
root@192.168.1.47's password:
Once on the target, use these steps to create a trace:
root@crownbay:~# lttng create
Spawning a session daemon
Session auto-20121015-232120 created.
Traces will be written in /home/root/lttng-traces/auto-20121015-232120
Enable the events you want to trace (in this case all kernel events):
root@crownbay:~# lttng enable-event --kernel --all
All kernel events are enabled in channel channel0
Start the trace:
root@crownbay:~# lttng start
Tracing started for session auto-20121015-232120
And then stop the trace after awhile or after running a particular workload that you want to trace:
root@crownbay:~# lttng stop
Tracing stopped for session auto-20121015-232120
You can now view the trace in text form on the target:
root@crownbay:~# lttng view
[23:21:56.989270399] (+?.?????????) sys_geteuid: { 1 }, { }
[23:21:56.989278081] (+0.000007682) exit_syscall: { 1 }, { ret = 0 }
[23:21:56.989286043] (+0.000007962) sys_pipe: { 1 }, { fildes = 0xB77B9E8C }
[23:21:56.989321802] (+0.000035759) exit_syscall: { 1 }, { ret = 0 }
[23:21:56.989329345] (+0.000007543) sys_mmap_pgoff: { 1 }, { addr = 0x0, len = 10485760, prot = 3, flags = 131362, fd = 4294967295, pgoff = 0 }
[23:21:56.989351694] (+0.000022349) exit_syscall: { 1 }, { ret = -1247805440 }
[23:21:56.989432989] (+0.000081295) sys_clone: { 1 }, { clone_flags = 0x411, newsp = 0xB5EFFFE4, parent_tid = 0xFFFFFFFF, child_tid = 0x0 }
[23:21:56.989477129] (+0.000044140) sched_stat_runtime: { 1 }, { comm = "lttng-consumerd", tid = 1193, runtime = 681660, vruntime = 43367983388 }
[23:21:56.989486697] (+0.000009568) sched_migrate_task: { 1 }, { comm = "lttng-consumerd", tid = 1193, prio = 20, orig_cpu = 1, dest_cpu = 1 }
[23:21:56.989508418] (+0.000021721) hrtimer_init: { 1 }, { hrtimer = 3970832076, clockid = 1, mode = 1 }
[23:21:56.989770462] (+0.000262044) hrtimer_cancel: { 1 }, { hrtimer = 3993865440 }
[23:21:56.989771580] (+0.000001118) hrtimer_cancel: { 0 }, { hrtimer = 3993812192 }
[23:21:56.989776957] (+0.000005377) hrtimer_expire_entry: { 1 }, { hrtimer = 3993865440, now = 79815980007057, function = 3238465232 }
[23:21:56.989778145] (+0.000001188) hrtimer_expire_entry: { 0 }, { hrtimer = 3993812192, now = 79815980008174, function = 3238465232 }
[23:21:56.989791695] (+0.000013550) softirq_raise: { 1 }, { vec = 1 }
[23:21:56.989795396] (+0.000003701) softirq_raise: { 0 }, { vec = 1 }
[23:21:56.989800635] (+0.000005239) softirq_raise: { 0 }, { vec = 9 }
[23:21:56.989807130] (+0.000006495) sched_stat_runtime: { 1 }, { comm = "lttng-consumerd", tid = 1193, runtime = 330710, vruntime = 43368314098 }
[23:21:56.989809993] (+0.000002863) sched_stat_runtime: { 0 }, { comm = "lttng-sessiond", tid = 1181, runtime = 1015313, vruntime = 36976733240 }
[23:21:56.989818514] (+0.000008521) hrtimer_expire_exit: { 0 }, { hrtimer = 3993812192 }
[23:21:56.989819631] (+0.000001117) hrtimer_expire_exit: { 1 }, { hrtimer = 3993865440 }
[23:21:56.989821866] (+0.000002235) hrtimer_start: { 0 }, { hrtimer = 3993812192, function = 3238465232, expires = 79815981000000, softexpires = 79815981000000 }
[23:21:56.989822984] (+0.000001118) hrtimer_start: { 1 }, { hrtimer = 3993865440, function = 3238465232, expires = 79815981000000, softexpires = 79815981000000 }
[23:21:56.989832762] (+0.000009778) softirq_entry: { 1 }, { vec = 1 }
[23:21:56.989833879] (+0.000001117) softirq_entry: { 0 }, { vec = 1 }
[23:21:56.989838069] (+0.000004190) timer_cancel: { 1 }, { timer = 3993871956 }
[23:21:56.989839187] (+0.000001118) timer_cancel: { 0 }, { timer = 3993818708 }
[23:21:56.989841492] (+0.000002305) timer_expire_entry: { 1 }, { timer = 3993871956, now = 79515980, function = 3238277552 }
[23:21:56.989842819] (+0.000001327) timer_expire_entry: { 0 }, { timer = 3993818708, now = 79515980, function = 3238277552 }
[23:21:56.989854831] (+0.000012012) sched_stat_runtime: { 1 }, { comm = "lttng-consumerd", tid = 1193, runtime = 49237, vruntime = 43368363335 }
[23:21:56.989855949] (+0.000001118) sched_stat_runtime: { 0 }, { comm = "lttng-sessiond", tid = 1181, runtime = 45121, vruntime = 36976778361 }
[23:21:56.989861257] (+0.000005308) sched_stat_sleep: { 1 }, { comm = "kworker/1:1", tid = 21, delay = 9451318 }
[23:21:56.989862374] (+0.000001117) sched_stat_sleep: { 0 }, { comm = "kworker/0:0", tid = 4, delay = 9958820 }
[23:21:56.989868241] (+0.000005867) sched_wakeup: { 0 }, { comm = "kworker/0:0", tid = 4, prio = 120, success = 1, target_cpu = 0 }
[23:21:56.989869358] (+0.000001117) sched_wakeup: { 1 }, { comm = "kworker/1:1", tid = 21, prio = 120, success = 1, target_cpu = 1 }
[23:21:56.989877460] (+0.000008102) timer_expire_exit: { 1 }, { timer = 3993871956 }
[23:21:56.989878577] (+0.000001117) timer_expire_exit: { 0 }, { timer = 3993818708 }
.
.
.
You can now safely destroy the trace session (note that this doesn't delete the trace - it's still there in ~/lttng-traces):
root@crownbay:~# lttng destroy
Session auto-20121015-232120 destroyed at /home/root
Note that the trace is saved in a directory of the same name as returned by 'lttng create', under the ~/lttng-traces directory (note that you can change this by supplying your own name to 'lttng create'):
root@crownbay:~# ls -al ~/lttng-traces
drwxrwx---    3 root     root          1024 Oct 15 23:21 .
drwxr-xr-x    5 root     root          1024 Oct 15 23:57 ..
drwxrwx---    3 root     root          1024 Oct 15 23:21 auto-20121015-232120
Manually copying a trace to the host and viewing it in Eclipse (i.e. using Eclipse without network support)
If you already have an LTTng trace on a remote target and would like to view it in Eclipse on the host, you can easily copy it from the target to the host and import it into Eclipse to view it using the LTTng Eclipse plugin already bundled in the Eclipse (Juno SR1 or greater).
Using the trace we created in the previous section, archive it and copy it to your host system:
root@crownbay:~/lttng-traces# tar zcvf auto-20121015-232120.tar.gz auto-20121015-232120
auto-20121015-232120/
auto-20121015-232120/kernel/
auto-20121015-232120/kernel/metadata
auto-20121015-232120/kernel/channel0_1
auto-20121015-232120/kernel/channel0_0
$ scp root@192.168.1.47:lttng-traces/auto-20121015-232120.tar.gz .
root@192.168.1.47's password:
auto-20121015-232120.tar.gz                                             100% 1566KB   1.5MB/s   00:01
Unarchive it on the host:
$ gunzip -c auto-20121015-232120.tar.gz | tar xvf -
auto-20121015-232120/
auto-20121015-232120/kernel/
auto-20121015-232120/kernel/metadata
auto-20121015-232120/kernel/channel0_1
auto-20121015-232120/kernel/channel0_0
We can now import the trace into Eclipse and view it:
- First, start eclipse and open the 'LTTng Kernel' perspective by selecting the following menu item:
Window | Open Perspective | Other...
- In the dialog box that opens, select 'LTTng Kernel' from the list.
- Back at the main menu, select the following menu item:
File | New | Project...
- In the dialog box that opens, select the 'Tracing | Tracing Project' wizard and press 'Next>'.
- Give the project a name and press 'Finish'.
- In the 'Project Explorer' pane under the project you created, right click on the 'Traces' item.
- Select 'Import..." and in the dialog that's displayed:
- Browse the filesystem and find the select the 'kernel' directory containing the trace you copied from the target e.g. auto-20121015-232120/kernel
- 'Checkmark' the directory in the tree that's displayed for the trace
- Below that, select 'Common Trace Format: Kernel Trace' for the 'Trace Type'
- Press 'Finish' to close the dialog
- Back in the 'Project Explorer' pane, double-click on the 'kernel' item for the trace you just imported under 'Traces'
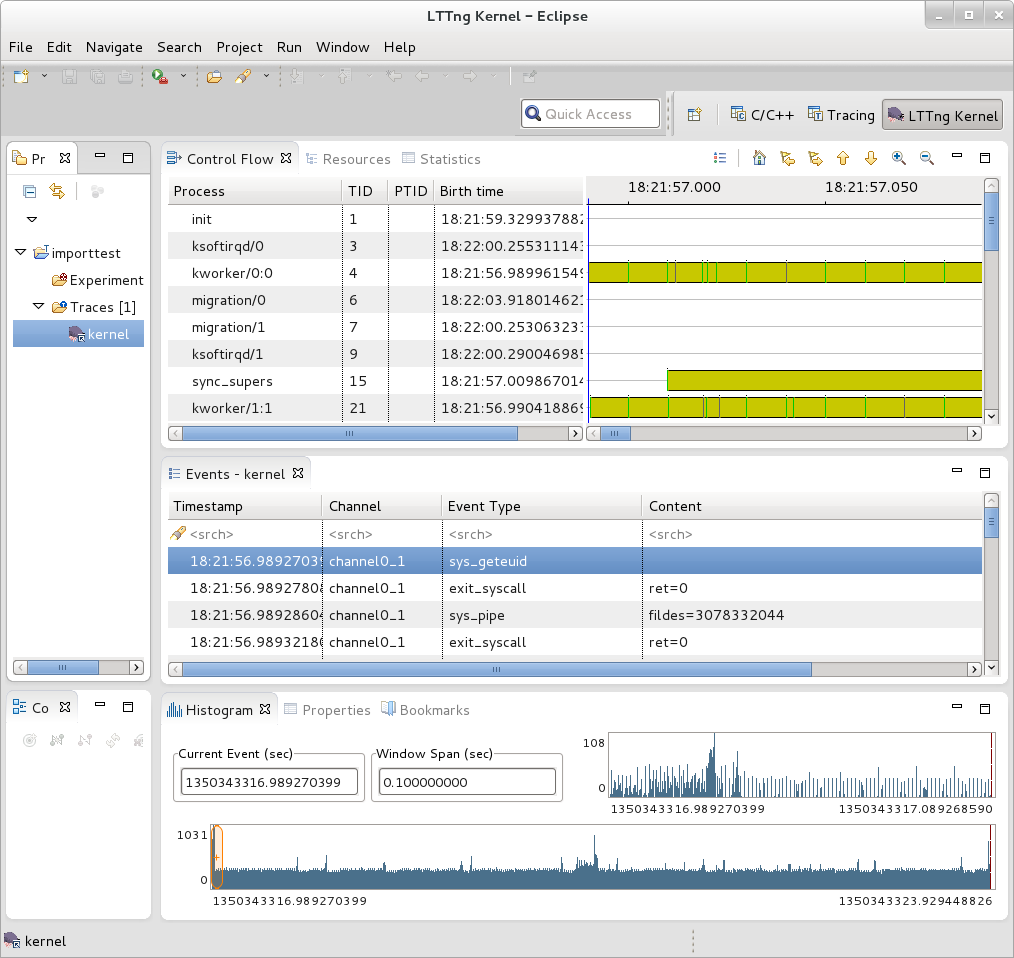
You should now see your trace data displayed graphically in several different views in Eclipse:
You can access extensive help information on how to use the LTTng plugin to search and analyze captured traces via the Eclipse help system:
Help | Help Contents | LTTng Plug-in User Guide
Collecting and viewing a trace in Eclipse
NOTE: This section on collecting traces remotely doesn't currently work because of Eclipse 'RSE' connectivity problems. Manually tracing on the target, copying the trace files to the host, and viewing the trace in Eclipse on the host as outlined in previous steps does work however - please use the manual steps outlined above to view traces in Eclipse.
In order to trace a remote target, you also need to add a 'tracing' group on the target and connect as a user who's part of that group e.g:
# adduser tomz
# groupadd -r tracing
# usermod -a -G tracing tomz
- First, start eclipse and open the 'LTTng Kernel' perspective by selecting the following menu item:
Window | Open Perspective | Other...
- In the dialog box that opens, select 'LTTng Kernel' from the list.
- Back at the main menu, select the following menu item:
File | New | Project...
- In the dialog box that opens, select the 'Tracing | Tracing Project' wizard and press 'Next>'.
- Give the project a name and press 'Finish'.
That should result in an entry in the 'Project' subwindow.
- In the 'Control' subwindow just below it, press 'New Connection'.
- Add a new connection, giving it the hostname or IP address of the target system.
Also provide the username and password of a qualified user (a member of the 'tracing' group) or root account on the target system.
Also, provide appropriate answers to whatever else is asked for e.g. 'secure storage password' can be anything you want
If you get an 'RSE Error' it may be due to proxies. It may be possible to get around the problem by changing the following setting:
Window | Preferences | Network Connections
Switch 'Active Provider' to 'Direct'
blktrace
blktrace is a tool for tracing and reporting low-level disk I/O. blktrace provides the tracing half of the equation; its output can be piped into the blkparse program, which renders the data in a human-readable form and does some basic analysis:
root@crownbay:~# blktrace /dev/sdc
^C=== sdc ===
 CPU  0:                 7082 events,      332 KiB data
 CPU  1:                 1578 events,       74 KiB data
 Total:                  8660 events (dropped 0),      406 KiB data
root@crownbay:/media/sdc# rm linux-2.6.19.2.tar.bz2; wget http://downloads.yoctoproject.org/mirror/sources/linux-2.6.19.2.tar.bz2; sync
Connecting to downloads.yoctoproject.org (140.211.169.59:80)
linux-2.6.19.2.tar.b 100% |*******************************| 41727k  0:00:00 ETA
root@crownbay:~# ls -al
drwxr-xr-x    6 root     root          1024 Oct 27 22:39 .
drwxr-sr-x    4 root     root          1024 Oct 26 18:24 ..
-rw-r--r--    1 root     root        339938 Oct 27 22:40 sdc.blktrace.0
-rw-r--r--    1 root     root         75753 Oct 27 22:40 sdc.blktrace.1
root@crownbay:~# blkparse sdc
 8,32   1        1     0.000000000  1225  Q  WS 3417048 + 8 [jbd2/sdc-8]
 8,32   1        2     0.000025213  1225  G  WS 3417048 + 8 [jbd2/sdc-8]
 8,32   1        3     0.000033384  1225  P   N [jbd2/sdc-8]
 8,32   1        4     0.000043301  1225  I  WS 3417048 + 8 [jbd2/sdc-8]
 8,32   1        0     0.000057270     0  m   N cfq1225 insert_request
 8,32   1        0     0.000064813     0  m   N cfq1225 add_to_rr
 8,32   1        5     0.000076336  1225  U   N [jbd2/sdc-8] 1
 8,32   1        0     0.000088559     0  m   N cfq workload slice:150
 8,32   1        0     0.000097359     0  m   N cfq1225 set_active wl_prio:0 wl_type:1
 8,32   1        0     0.000104063     0  m   N cfq1225 Not idling. st->count:1
 8,32   1        0     0.000112584     0  m   N cfq1225 fifo=  (null)
 8,32   1        0     0.000118730     0  m   N cfq1225 dispatch_insert
 8,32   1        0     0.000127390     0  m   N cfq1225 dispatched a request
 8,32   1        0     0.000133536     0  m   N cfq1225 activate rq, drv=1
 8,32   1        6     0.000136889  1225  D  WS 3417048 + 8 [jbd2/sdc-8]
 8,32   1        7     0.000360381  1225  Q  WS 3417056 + 8 [jbd2/sdc-8]
 8,32   1        8     0.000377422  1225  G  WS 3417056 + 8 [jbd2/sdc-8]
 8,32   1        9     0.000388876  1225  P   N [jbd2/sdc-8]
 8,32   1       10     0.000397886  1225  Q  WS 3417064 + 8 [jbd2/sdc-8]
 8,32   1       11     0.000404800  1225  M  WS 3417064 + 8 [jbd2/sdc-8]
 8,32   1       12     0.000412343  1225  Q  WS 3417072 + 8 [jbd2/sdc-8]
 8,32   1       13     0.000416533  1225  M  WS 3417072 + 8 [jbd2/sdc-8]
 8,32   1       14     0.000422121  1225  Q  WS 3417080 + 8 [jbd2/sdc-8]
 8,32   1       15     0.000425194  1225  M  WS 3417080 + 8 [jbd2/sdc-8]
 8,32   1       16     0.000431968  1225  Q  WS 3417088 + 8 [jbd2/sdc-8]
 8,32   1       17     0.000435251  1225  M  WS 3417088 + 8 [jbd2/sdc-8]
 8,32   1       18     0.000440279  1225  Q  WS 3417096 + 8 [jbd2/sdc-8]
 8,32   1       19     0.000443911  1225  M  WS 3417096 + 8 [jbd2/sdc-8]
 8,32   1       20     0.000450336  1225  Q  WS 3417104 + 8 [jbd2/sdc-8]
 8,32   1       21     0.000454038  1225  M  WS 3417104 + 8 [jbd2/sdc-8]
 8,32   1       22     0.000462070  1225  Q  WS 3417112 + 8 [jbd2/sdc-8]
 8,32   1       23     0.000465422  1225  M  WS 3417112 + 8 [jbd2/sdc-8]
 8,32   1       24     0.000474222  1225  I  WS 3417056 + 64 [jbd2/sdc-8]
 8,32   1        0     0.000483022     0  m   N cfq1225 insert_request
 8,32   1       25     0.000489727  1225  U   N [jbd2/sdc-8] 1
 8,32   1        0     0.000498457     0  m   N cfq1225 Not idling. st->count:1
 8,32   1        0     0.000503765     0  m   N cfq1225 dispatch_insert
 8,32   1        0     0.000512914     0  m   N cfq1225 dispatched a request
 8,32   1        0     0.000518851     0  m   N cfq1225 activate rq, drv=2
 .
 .
 .
 8,32   0        0    58.515006138     0  m   N cfq3551 complete rqnoidle 1
 8,32   0     2024    58.516603269     3  C  WS 3156992 + 16 [0]
 8,32   0        0    58.516626736     0  m   N cfq3551 complete rqnoidle 1
 8,32   0        0    58.516634558     0  m   N cfq3551 arm_idle: 8 group_idle: 0
 8,32   0        0    58.516636933     0  m   N cfq schedule dispatch
 8,32   1        0    58.516971613     0  m   N cfq3551 slice expired t=0
 8,32   1        0    58.516982089     0  m   N cfq3551 sl_used=13 disp=6 charge=13 iops=0 sect=80
 8,32   1        0    58.516985511     0  m   N cfq3551 del_from_rr
 8,32   1        0    58.516990819     0  m   N cfq3551 put_queue

CPU0 (sdc):
 Reads Queued:           0,        0KiB	 Writes Queued:         331,   26,284KiB
 Read Dispatches:        0,        0KiB	 Write Dispatches:      485,   40,484KiB
 Reads Requeued:         0		 Writes Requeued:         0
 Reads Completed:        0,        0KiB	 Writes Completed:      511,   41,000KiB
 Read Merges:            0,        0KiB	 Write Merges:           13,      160KiB
 Read depth:             0        	 Write depth:             2
 IO unplugs:            23        	 Timer unplugs:           0
CPU1 (sdc):
 Reads Queued:           0,        0KiB	 Writes Queued:         249,   15,800KiB
 Read Dispatches:        0,        0KiB	 Write Dispatches:       42,    1,600KiB
 Reads Requeued:         0		 Writes Requeued:         0
 Reads Completed:        0,        0KiB	 Writes Completed:       16,    1,084KiB
 Read Merges:            0,        0KiB	 Write Merges:           40,      276KiB
 Read depth:             0        	 Write depth:             2
 IO unplugs:            30        	 Timer unplugs:           1

Total (sdc):
 Reads Queued:           0,        0KiB	 Writes Queued:         580,   42,084KiB
 Read Dispatches:        0,        0KiB	 Write Dispatches:      527,   42,084KiB
 Reads Requeued:         0		 Writes Requeued:         0
 Reads Completed:        0,        0KiB	 Writes Completed:      527,   42,084KiB
 Read Merges:            0,        0KiB	 Write Merges:           53,      436KiB
 IO unplugs:            53        	 Timer unplugs:           1

Throughput (R/W): 0KiB/s / 719KiB/s
Events (sdc): 6,592 entries
Skips: 0 forward (0 -   0.0%)
Input file sdc.blktrace.0 added
Input file sdc.blktrace.1 added
Live mode:
root@crownbay:~# btrace /dev/sdc
The above 'btrace' command is equivalent to a blktrace run with the output piped into blkparse using stdout/stdin:
root@crownbay:~# blktrace /dev/sdc -o - | blkparse -i -
root@crownbay:/sys/kernel/debug/tracing# echo 1 > /sys/block/sdc/trace/enable
root@crownbay:/sys/kernel/debug/tracing# cat available_tracers
blk function_graph function nop
root@crownbay:/sys/kernel/debug/tracing# echo blk > current_tracer
root@crownbay:/sys/kernel/debug/tracing# cat /media/sdc/testfile.txt
root@crownbay:/sys/kernel/debug/tracing# cat trace_pipe
            cat-3587  [001] d..1  3023.276361:   8,32   Q   R 1699848 + 8 [cat]
            cat-3587  [001] d..1  3023.276410:   8,32   m   N cfq3587 alloced
            cat-3587  [001] d..1  3023.276415:   8,32   G   R 1699848 + 8 [cat]
            cat-3587  [001] d..1  3023.276424:   8,32   P   N [cat]
            cat-3587  [001] d..2  3023.276432:   8,32   I   R 1699848 + 8 [cat]
            cat-3587  [001] d..1  3023.276439:   8,32   m   N cfq3587 insert_request
            cat-3587  [001] d..1  3023.276445:   8,32   m   N cfq3587 add_to_rr
            cat-3587  [001] d..2  3023.276454:   8,32   U   N [cat] 1
            cat-3587  [001] d..1  3023.276464:   8,32   m   N cfq workload slice:150
            cat-3587  [001] d..1  3023.276471:   8,32   m   N cfq3587 set_active wl_prio:0 wl_type:2
            cat-3587  [001] d..1  3023.276478:   8,32   m   N cfq3587 fifo=  (null)
            cat-3587  [001] d..1  3023.276483:   8,32   m   N cfq3587 dispatch_insert
            cat-3587  [001] d..1  3023.276490:   8,32   m   N cfq3587 dispatched a request
            cat-3587  [001] d..1  3023.276497:   8,32   m   N cfq3587 activate rq, drv=1
            cat-3587  [001] d..2  3023.276500:   8,32   D   R 1699848 + 8 [cat]
root@crownbay:/sys/kernel/debug/tracing# echo 0 > /sys/block/sdc/trace/enable
Documentation
http://linux.die.net/man/8/blktrace http://linux.die.net/man/1/blkparse http://linux.die.net/man/8/btrace
The above manpages, along with manpages for the other blktrace utilities (btt, blkiomon, etc) can be found in the /doc directory of the blktrace tools git repo:
$ git clone git://git.kernel.dk/blktrace.git
systemtap
SystemTap is a system-wide script-based tracing and profiling tool.
SystemTap scripts are C-like programs that are executed in the kernel to gather/print/aggregate data extracted from the context they end up being invoked under.
For example, this probe from the SystemTap tutorial [1] simply prints a line every time any process on the system open()s a file. For each line, it prints the executable name of the program that opened the file, along with its pid, and the name of the file it opened (or tried to open), which it extracts from the open syscall's argstr.
probe syscall.open
{
        printf ("%s(%d) open (%s)\n", execname(), pid(), argstr)
}

probe timer.ms(4000) # after 4 seconds
{
        exit ()
}
Normally, to execute this probe, you'd simply install systemtap on the system you want to probe, and directly run the probe on that system e.g. assuming the name of the file containing the above text is trace_open.stp:
# stap trace_open.stp
What systemtap does under the covers to run this probe is 1) parse and convert the probe to an equivalent 'C' form, 2) compile the 'C' form into a kernel module, 3) insert the module into the kernel, which arms it, and 4) collect the data generated by the probe and display it to the user.
In order to accomplish steps 1 and 2, the 'stap' program needs access to the kernel build system that produced the kernel that the probed system is running. In the case of a typical embedded system (the 'target'), the kernel build system unfortunately isn't typically part of the image running on the target. It is normally available on the 'host' system that produced the target image however; in such cases, steps 1 and 2 are executed on the host system, and steps 3 and 4 are executed on the target system, using only the systemtap 'runtime'.
The systemtap support in Yocto assumes that only steps 3 and 4 are run on the target; it is possible to do everything on the target, but this section assumes only the typical embedded use-case.
So basically what you need to do in order to run a systemtap script on the target is to 1) on the host system, compile the probe into a kernel module that makes sense to the target, 2) copy the module onto the target system and 3) insert the module into the target kernel, which arms it, and 4) collect the data generated by the probe and display it to the user.
Setup
Those are a lot of steps and a lot of details, but fortunately Yocto includes a script called 'crosstap' that will take care of those details, allowing you to simply execute a systemtap script on the remote target, with arguments if necessary.
In order to do this from a remote host, however, you need to have access to the build for the image you booted. The 'crosstap' script provides details on how to do this if you run the script on the host without having done a build:
$ crosstap root@192.168.1.88 trace_open.stp

Error: No target kernel build found.
Did you forget to create a local build of your image?

'crosstap' requires a local sdk build of the target system
(or a build that includes 'tools-profile') in order to build
kernel modules that can probe the target system.

Practically speaking, that means you need to do the following:
 - If you're running a pre-built image, download the release
   and/or BSP tarballs used to build the image.
 - If you're working from git sources, just clone the metadata
   and BSP layers needed to build the image you'll be booting.
 - Make sure you're properly set up to build a new image (see
   the BSP README and/or the widely available basic documentation
   that discusses how to build images).
 - Build an -sdk version of the image e.g.:
     $ bitbake core-image-sato-sdk
 OR
 - Build a non-sdk image but include the profiling tools:
     [ edit local.conf and add 'tools-profile' to the end of
       the EXTRA_IMAGE_FEATURES variable ]
     $ bitbake core-image-sato

 [ NOTE that 'crosstap' needs to be able to ssh into the target
   system, which isn't enabled by default in -minimal images. ]

Once you've build the image on the host system, you're ready to
boot it (or the equivalent pre-built image) and use 'crosstap'
to probe it (you need to source the environment as usual first):

   $ source oe-init-build-env
   $ cd ~/my/systemtap/scripts
   $ crosstap root@192.168.1.xxx myscript.stp
So essentially what you need to do is build an SDK image or image with 'tools-profile' as detailed in the 'General Setup' section of this wiki, and boot the resulting target image.
NOTE: if you have a build directory containing multiple machines, you need to have the MACHINE you're connecting to selected in local.conf, and the kernel in that machine's build directory must match the kernel on the booted system exactly, or you'll get the above 'crosstap' message when you try to invoke a script.
Running a script on the target
Once you've done that, you should be able to run a systemtap script on the target:
$ cd /path/to/yocto
$ source oe-init-build-env
### Shell environment set up for builds. ###

You can now run 'bitbake <target>'

Common targets are:
   core-image-minimal
   core-image-sato
   meta-toolchain
   meta-toolchain-sdk
   adt-installer
   meta-ide-support

You can also run generated qemu images with a command like 'runqemu qemux86'
Once you've done that, you can cd to whatever directory contains your scripts and use 'crosstap' to run the script:
$ cd /path/to/my/systemap/script
$ crosstap root@192.168.7.2 trace_open.stp
If you get an error connecting to the target e.g.:
$ crosstap root@192.168.7.2 trace_open.stp
error establishing ssh connection on remote 'root@192.168.7.2'
Try ssh'ing to the target and see what happens:
$ ssh root@192.168.7.2
A lot of the time, connection problems are due specifying a wrong IP address or having a 'host key verification error'.
If everything worked as planned, you should see something like this (enter the password when prompted, or press enter if its set up to use no password):
$ crosstap root@192.168.7.2 trace_open.stp
root@192.168.7.2's password:
matchbox-termin(1036) open ("/tmp/vte3FS2LW", O_RDWR|O_CREAT|O_EXCL|O_LARGEFILE, 0600)
matchbox-termin(1036) open ("/tmp/vteJMC7LW", O_RDWR|O_CREAT|O_EXCL|O_LARGEFILE, 0600)
