TipsAndTricks/InvestigatingBuildTime
Draft: Investigating Build Time
(Placeholder. Demonstrate use of buildstats and pybootchartgui)
Current status: The intention is to use the scripts under scripts/contrib/bb-perf to parse buildstat data and produce useful plots.
The buildstats data produced by the class with the same name provides process statistics for every recipe task.
This data can offer insight of the time spent by the builder (bitbake) when
constructing a particular target at process level. This article focus more on profiling than optimization, the former being
the base for the latter.
Setup
 $ cd poky
 $ git checkout -b morty origin/morty
 $ . oe-init-build-env
 $ bitbake world
Buildstats
buildstats.bbclass stores mainly two set of process' stats: time and IO stats. For the moment, we are currently focusing on the following time data:
- /proc/[pid]/stat: utime, stime
- /proc/[pid]/stat: cutime, cstime
- python resource module: rusage ru_utime, rusage ru_stime
- python resource module: Child rusage ru_utime, Child rusage ru_stime
and the IO stats:
- /proc/[pid]/io: IO rchar, IO wchar
- /proc/[pid]/io: IO read_bytes, IO write_bytes
With this data, the following script (once the bitbake world command has finished) is used
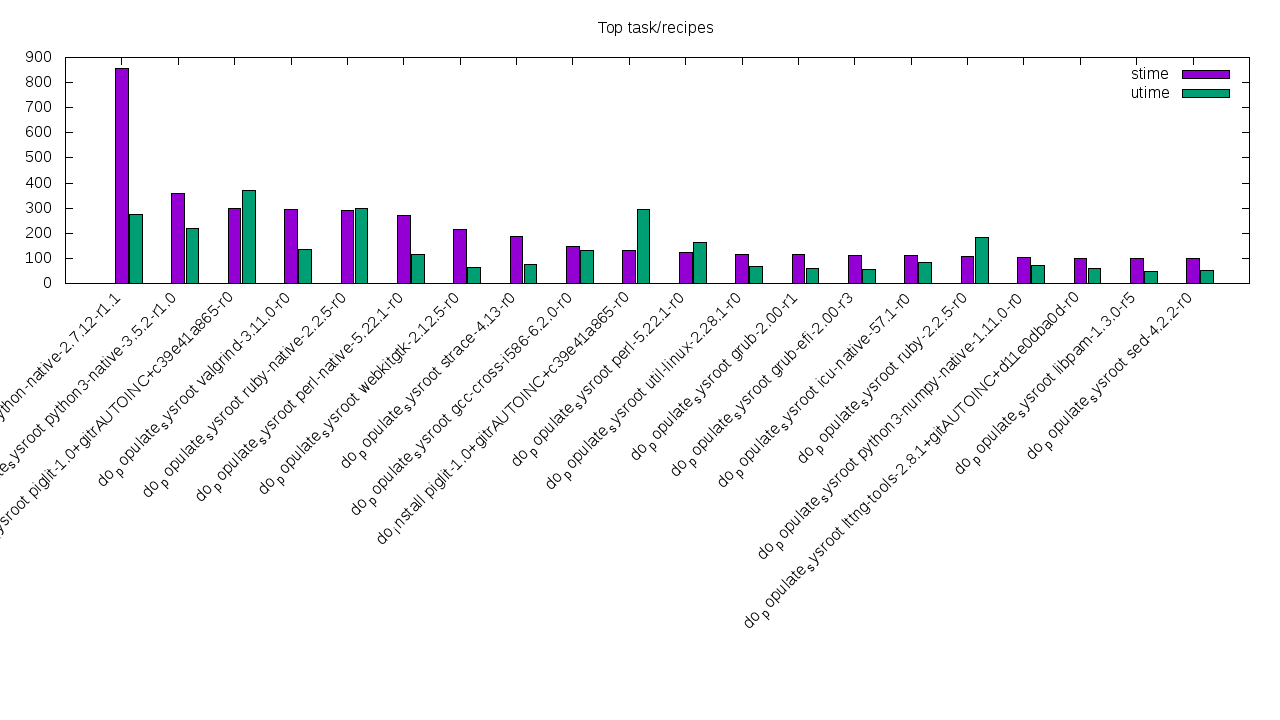
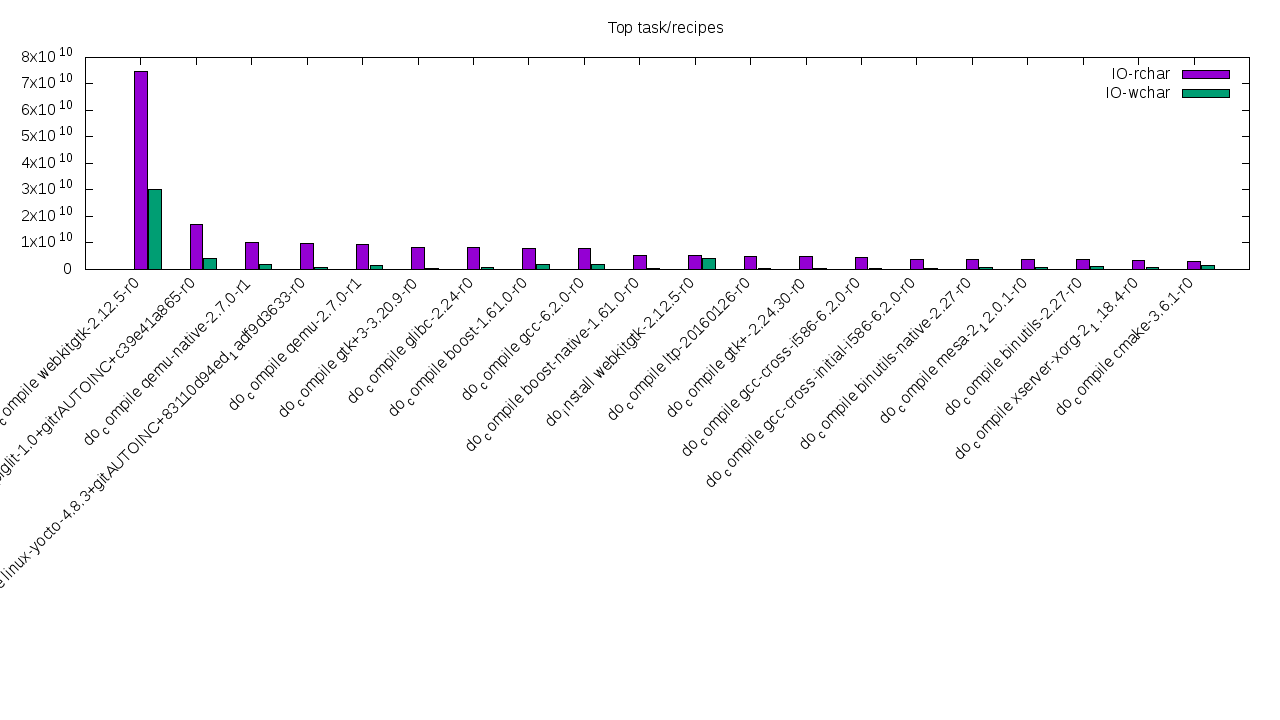
to either plot the top N recipes-task stat values
$ ../scripts/contrib/bb-perf/buildstats-plot.sh -s <BUILDSTATS> -N $N | gnuplot -p
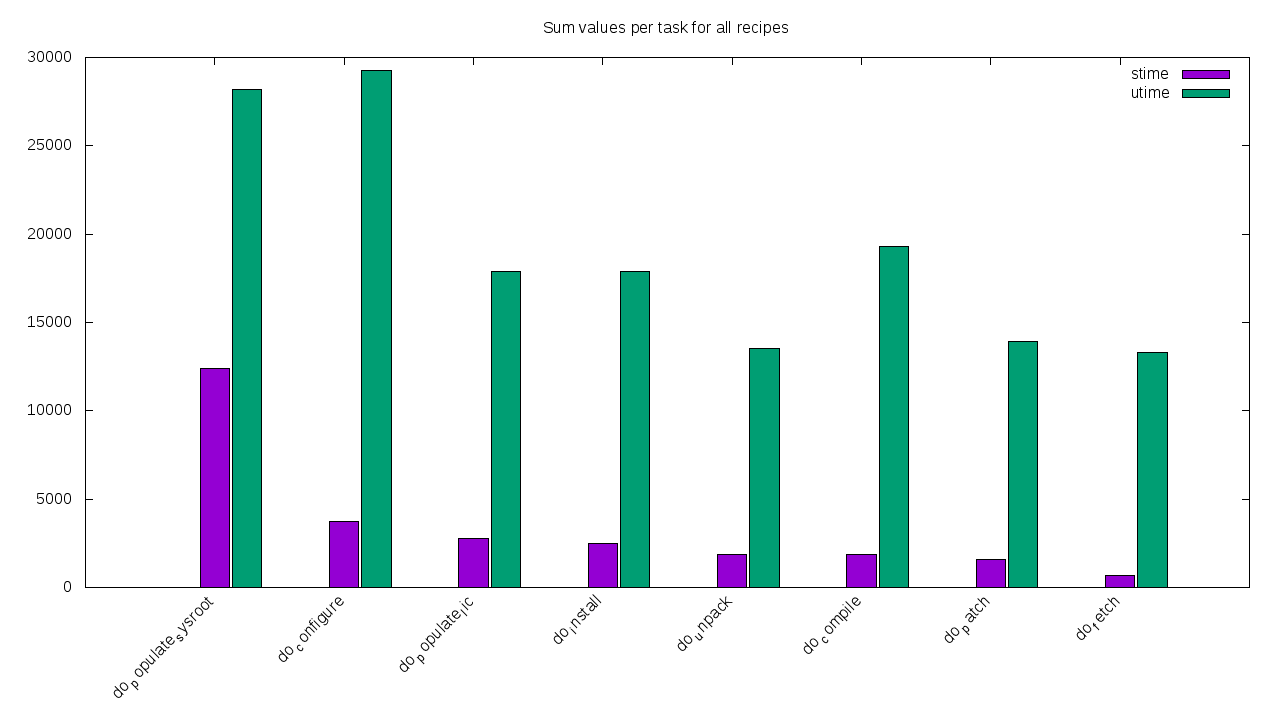
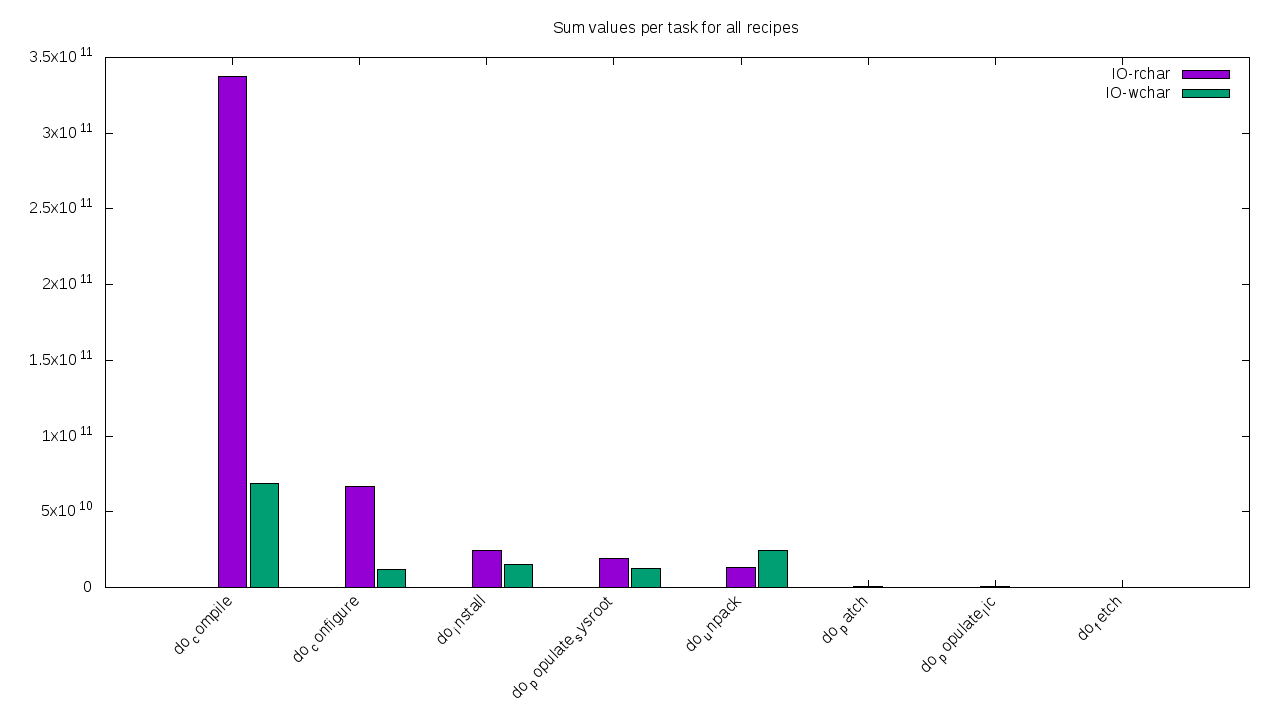
or sum stats values per task for all (world) recipes
$ ../scripts/contrib/bb-perf/buildstats-plot.sh -s <BUILDSTATS> -S | gnuplot -p
The former produces a more granular plot and second a more general idea where the type is spent per task set.
Setup
GPLIMAGE='set terminal png fontscale 1 size 1280,720'
function bsplots() {
  local STAT=$1
  OUT="set output '$STAT.task-recipe.png'"
  ../scripts/contrib/bb-perf/buildstats-plot.sh -s "$STAT" -n 20 > input.gpl
  gnuplot -e "$GPLIMAGE;$OUT" input.gpl
  OUT="set output '$STAT.task.png'"
  ../scripts/contrib/bb-perf/buildstats-plot.sh -s "$STAT" -S > input.gpl
  gnuplot -e "$GPLIMAGE;$OUT" input.gpl
}
Results
Time Results
bsplots "stime:utime"
IO Results
bsplots "IO rchar:IO wchar"


