Tracing and Profiling
Tracing and Profiling in Yocto
Yocto bundles a number of tracing and profiling tools - this 'HOWTO' describes their basic usage and more importantly shows by example how they fit together and how to make use of them to solve real-world problems.
The tools presented are for the most part completely open-ended and have quite good and/or extensive documentation of their own which can be used to solve just about any problem you might come across in Linux. Each section that describes a particular tool has links to that tool's documentation and website.
The purpose of this 'HOWTO' is to present a set of common and generally useful tracing and profiling idioms along with their application (as appropriate) to each tool, in the context of a general-purpose 'drill-down' methodology that can be applied to solving a large number (90%?) of problems. For help with more advanced usages and problems, please see the documentation and/or websites listed for each tool.
General Setup
Most of the tools are available only in 'sdk' images or in images built after adding 'tools-profile' to your local.conf. So, in order to be able to access all of the tools described here, please first build and boot an 'sdk' image e.g.
$ bitbake core-image-sato-sdk
or alternatively by adding 'tools-profile' to the EXTRA_IMAGE_FEATURES line in your local.conf:
EXTRA_IMAGE_FEATURES = "debug-tweaks tools-profile"
If you use the 'tools-profile' method, you don't need to build an sdk image - the tracing and profiling tools will be included in non-sdk images as well e.g.:
$ bitbake core-image-sato
Overall Architecture of the Linux Tracing and Profiling Tools
It may seem surprising to see a section covering an 'overall architecture' for what seems to be a random collection of tracing tools that together make up the Linux tracing and profiling space. The fact is, however, that in recent years this seemingly disparate set of tools has started to converge on a 'core' set of underlying mechanisms:
- static tracepoints
- dynamic tracepoints
- kprobes
- uprobes
- the perf_events subsystem
- debugfs
A Few Real-world Examples
Custom Top
Yocto Bug 3049
Slow write speed on live images with denzil
Autodidacting the Graphics Stack
Using ftrace, perf, and systemtap to learn about the i915 graphics stack.
Determining whether 3-D rendering is using the hardware (without special test-suites)
The standard (simple) 3-D graphics programs can't always be used to unequivocally determine whether hardware rendering or a fallback software rendering mode is being used e.g. PVR graphics. We can however use the tracing tools to unequivocally determine whether hardware or software rendering is being used regardless of what the test programs are telling us, or in spite of the fact that we may be using a proprietary stack.
This example will provide a simple yes/no test based on tracing output.
Basic Usage (with examples) for each of the Yocto Tracing Tools
perf
The 'perf' tool is the profiling and tracing tool that comes bundled with the Linux kernel.
Don't let the fact that it's part of the kernel fool you into thinking that it's only for tracing and profiling the kernel - you can indeed use it to trace and profile just the kernel , but you can also use it to profile specific applications separately (with or without kernel context), and you can also use it to trace and profile the kernel and all applications on the system simultaneously to gain a system-wide view of what's going on in the system.
In many ways, it aims to be a superset of all the tracing and profiling tools available in Linux today, including all the other tools covered in this HOWTO. The past couple of years have seen perf subsume a lot of the functionality of those other tools, and at the same time those other tools have removed large portions of their previous functionality and replaced it with calls to the equivalent functionality now implemented by the perf subsystem. Extrapolation suggests that at some point those other tools will simply become completely redundant and go away; until then, we'll cover those other tools in these pages and in many cases show how the same things can be accomplished in perf and the other tools when it seems useful to do so.
The coverage below details some of the most common ways you'll likely want to apply the tool; full documentation can be found either within the tool itself or in the man pages:
Setup
For this section, we'll assume you've already performed the basic setup outlined in the General Setup section.
In addition, for use in illustrating the steps involved in profiling a 'real-world' application, enable the 'web2' browser in yocto by adding the following line to your local.conf:
WEB = "web-webkit"
Usage
root@crownbay:~# perf

usage: perf [--version] [--help] COMMAND [ARGS]

The most commonly used perf commands are:
  annotate        Read perf.data (created by perf record) and display annotated code
  archive         Create archive with object files with build-ids found in perf.data file
  bench           General framework for benchmark suites
  buildid-cache   Manage build-id cache.
  buildid-list    List the buildids in a perf.data file
  diff            Read two perf.data files and display the differential profile
  evlist          List the event names in a perf.data file
  inject          Filter to augment the events stream with additional information
  kmem            Tool to trace/measure kernel memory(slab) properties
  kvm             Tool to trace/measure kvm guest os
  list            List all symbolic event types
  lock            Analyze lock events
  probe           Define new dynamic tracepoints
  record          Run a command and record its profile into perf.data
  report          Read perf.data (created by perf record) and display the profile
  sched           Tool to trace/measure scheduler properties (latencies)
  script          Read perf.data (created by perf record) and display trace output
  stat            Run a command and gather performance counter statistics
  test            Runs sanity tests.
  timechart       Tool to visualize total system behavior during a workload
  top             System profiling tool.

See 'perf help COMMAND' for more information on a specific command.
As a simple test case, we'll wget a fairly large file, which is a minimally interesting case because it has both file and network I/O aspects, and at least in the case of standard Yocto images, it's implemented as part of busybox, so the methods we use to analyze it can be used in a very similar way to the whole host of supported busybox applets in Yocto.
root@crownbay:~# rm linux-2.6.19.2.tar.bz2; wget http://downloads.yoctoproject.org/mirror/sources/linux-2.6.19.2.tar.bz2
As our first attempt at profiling this workload, we'll simply run 'perf record', handing it the workload we want to profile (everything after 'perf record' and any perf options we hand it - here none - will be executed in a new shell). perf collects samples until the process exits and records them in a file named 'perf.data' in the current working directory.
root@crownbay:~# perf record wget http://downloads.yoctoproject.org/mirror/sources/linux-2.6.19.2.tar.bz2

Connecting to downloads.yoctoproject.org (140.211.169.59:80)
linux-2.6.19.2.tar.b 100% |************************************************| 41727k  0:00:00 ETA
[ perf record: Woken up 1 times to write data ]
[ perf record: Captured and wrote 0.176 MB perf.data (~7700 samples) ]
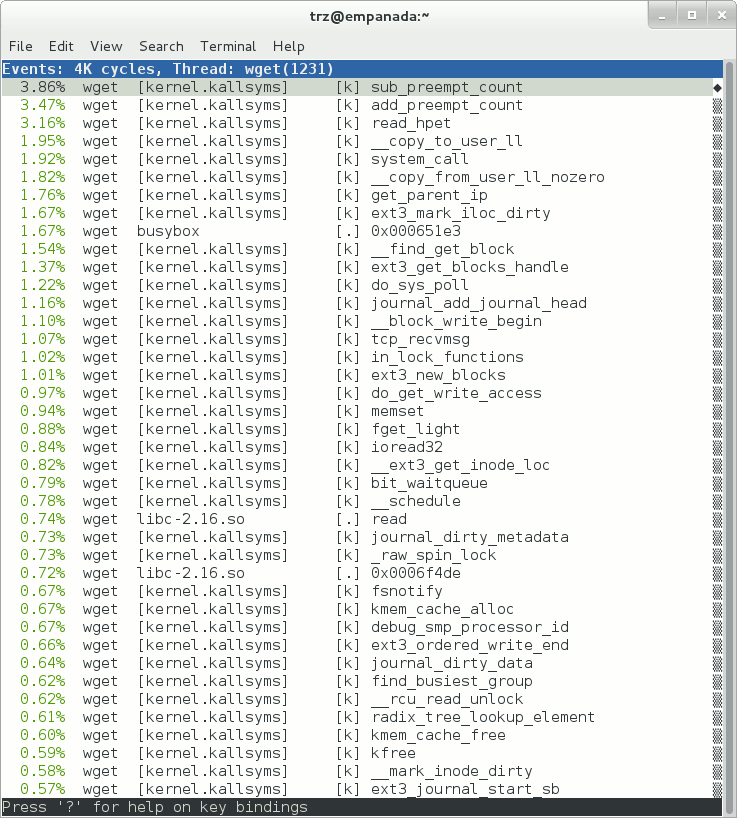
To see the results in a 'text-based UI' (tui), simply run 'perf report', which will read the perf.data file in the current working directory and display the results in an interactive UI:
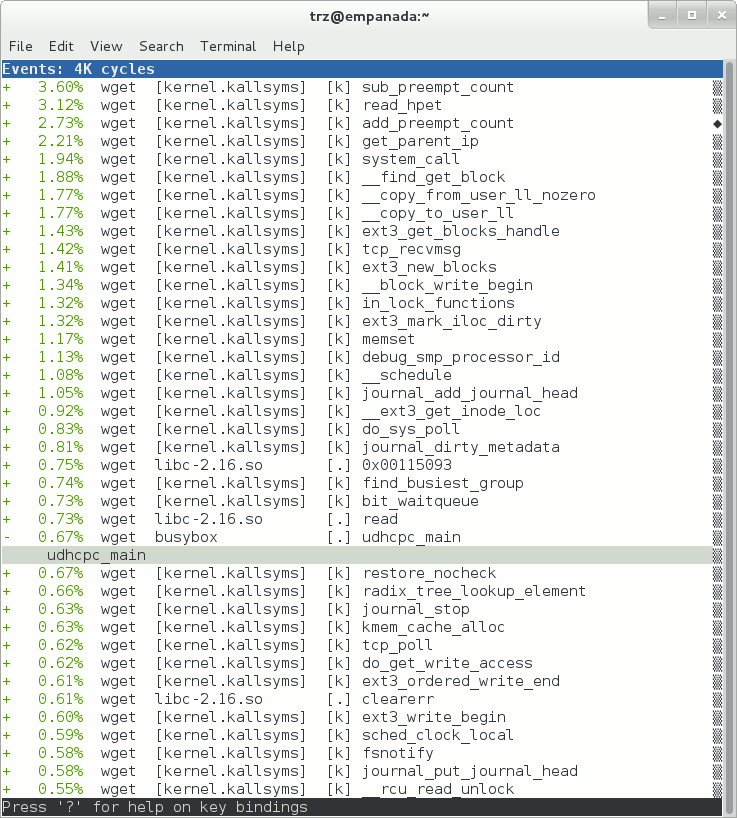
root@crownbay:~# perf report
The above screenshot displays a 'flat' profile, one entry for each 'bucket' corresponding to the functions that were profiled during the profiling run, ordered from the most popular to the least (perf has options to sort in various orders and keys as well as display entries only above a certain threshold and so on - see the perf documentation for details). Note that this includes both userspace functions (entries containing a [.]) and kernel functions accounted to the process (entries containing a [k]). (perf has command-line modifiers that can be used to restrict the profiling to kernel or userspace, among others).
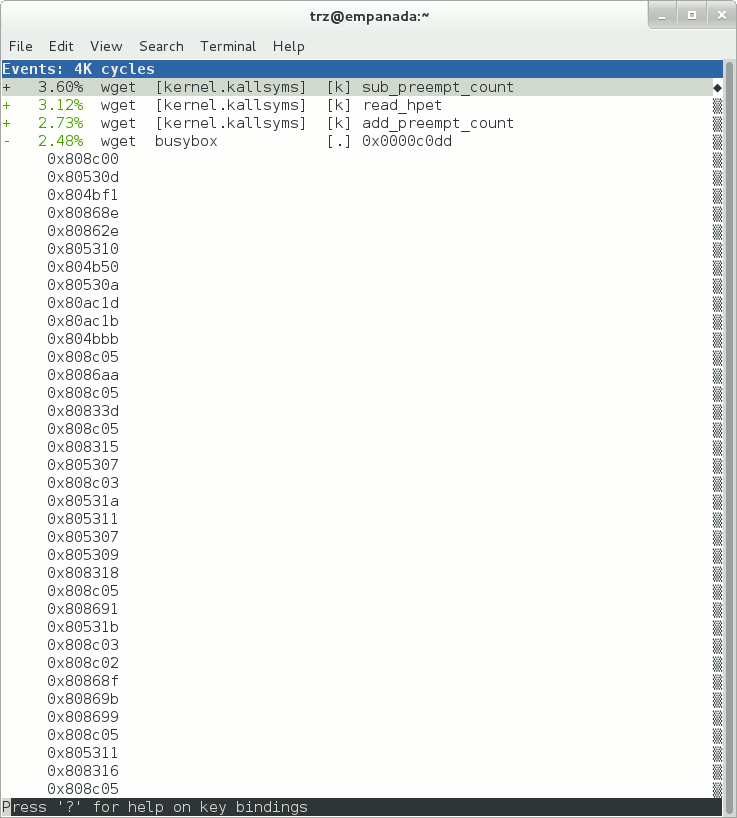
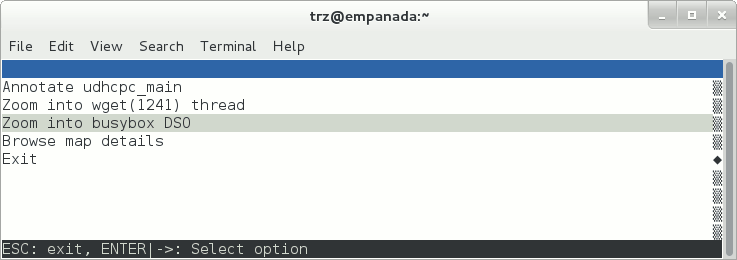
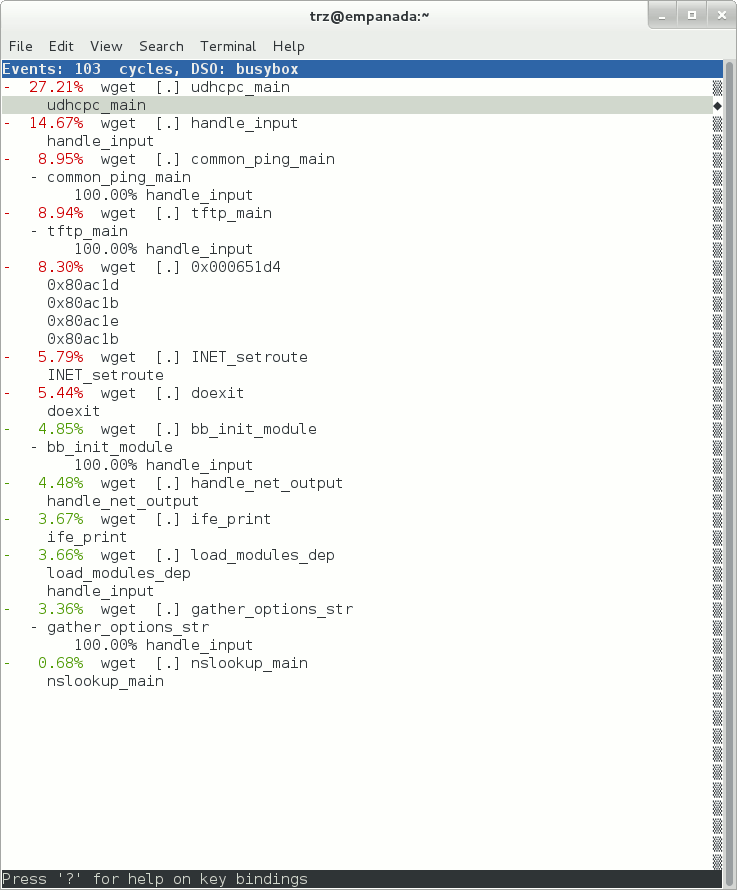
Notice also that the above report shows an entry for 'busybox', which is the executable that implements 'wget' in Yocto, but that instead of a useful function name in that entry, it displays an not-so-friendly hex value instead. The steps below will show how to fix that problem.
Before we do that, however, let's try running a different profile, one which shows something a little more interesting. The only difference between the new profile and the previous one is that we'll add the -g option, which will record not just the address of a sampled function, but the entire callchain to the sampled function as well:
root@crownbay:~# perf record -g wget http://downloads.yoctoproject.org/mirror/sources/linux-2.6.19.2.tar.bz2
Connecting to downloads.yoctoproject.org (140.211.169.59:80)
linux-2.6.19.2.tar.b 100% |************************************************| 41727k  0:00:00 ETA
[ perf record: Woken up 3 times to write data ]
[ perf record: Captured and wrote 0.652 MB perf.data (~28476 samples) ]
root@crownbay:~# perf report
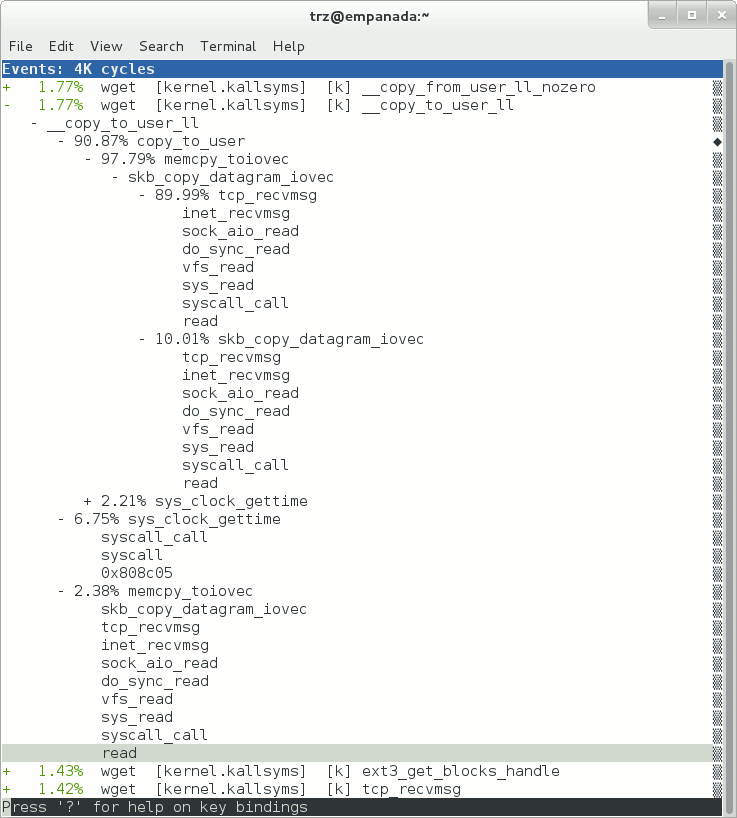
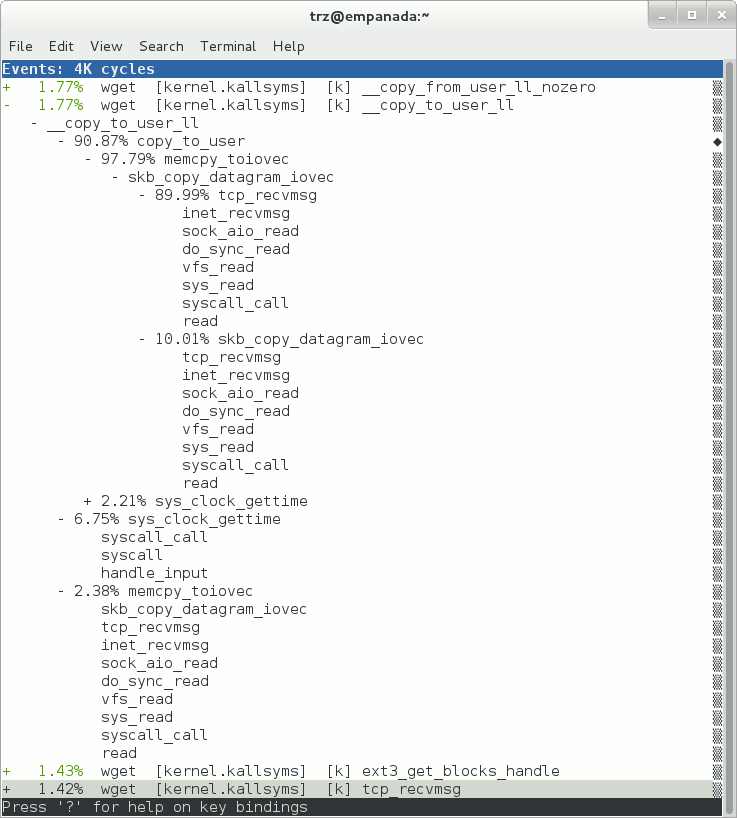
Using the callgraph view, we can actually see not only which functions took the most time, but we can also see a summary of how those functions were called and learn something about how the program interacts with the kernel in the process.
Notice that each entry in the above screenshot now contains a '+' on the left-hand side. This means that we can expand the entry and drill down into the callchains that feed into that entry. Pressing 'enter' on any one of them will expand the callchain (you can also press 'E' to expand them all at the same time or 'C' to collapse them all).
In the screenshot above, we've toggled the __copy_to_user_ll() entry and several subnodes all the way down. This lets us see which callchains contributed to the profiled __copy_to_user_ll() function which contributed 1.77% to the total profile.
As a bit of background explanation for these callchains, think about what happens at a high level when you run wget to get a file out on the network. Basically what happens is that the data comes into the kernel via the network connection (socket) and is passed to the userspace program 'wget' (which is actually a part of busybox, but that's not important for now), which takes the buffers the kernel passes to it and writes it to a disk file to save it.
The part of this process that we're looking at in the above call stacks is the part where the kernel passes the data it's read from the socket down to wget i.e. a copy-to-user.
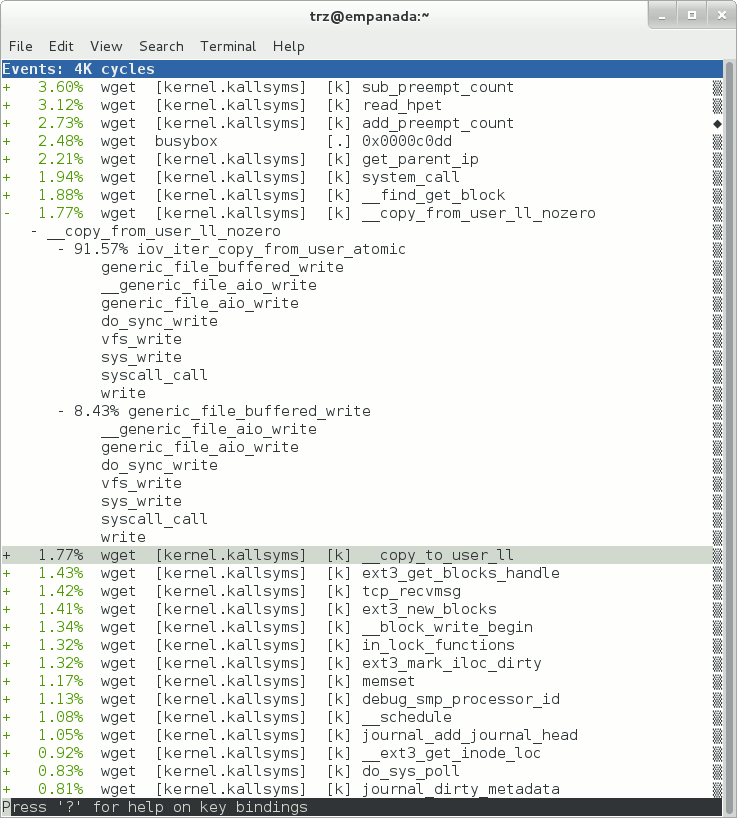
The above screenshot shows the other half of the journey for the data - from the wget program's userspace buffers to disk. To get the buffers to disk, the wget program issues a write(2), which does a copy-from-user to the kernel, which then takes care via some circuitous path (probably also present somewhere in the profile data), to get it safely to disk.
root@crownbay:~# perf script rwtop

read counts by pid:

  pid                  comm     # reads   bytes_req  bytes_read
-----  --------------------  ----------  ----------  ----------
 1607  perf                       25563      970864      970696
 1611  wget                          18       30721        4747
 1527  dropbear                      14      229250         919
 1610  rm                             2         513         512
 1551  dropbear                       5       49173         112
 1437  syslogd                        1         255          69
 1416  connmand                       4          64          16
 1552                                 0           0           1

write counts by pid:

  pid                  comm    # writes  bytes_written
-----  --------------------  ----------  -------------
 1605  perf                          52        3793192
 1527  dropbear                      14           1504
 1607  perf                          16            899
 1551  dropbear                       4            193
 1611  wget                           2            187
 1437  syslogd                        1             86
 1416  connmand                       4             32
 1552  sh                             1              1
ftrace
trace-cmd/kernelshark
oprofile
sysprof
LTTng (Linux Trace Toolkit, next generation)
Setup
NOTE: The lttng support in Yocto 1.3 (danny) needs the following poky commits applied in order to work:
- http://git.yoctoproject.org/cgit/cgit.cgi/poky-contrib/commit/?h=tzanussi/switch-to-lttng2&id=ea602300d9211669df0acc5c346e4486d6bf6f67
- http://git.yoctoproject.org/cgit/cgit.cgi/poky-contrib/commit/?h=tzanussi/lttng-fixes.0&id=1d0dc88e1635cfc24612a3e97d0391facdc2c65f
If you also want to view the LTTng traces graphically, you also need to download and install/run the 'SR1' or later Juno release of eclipse e.g.:
Collecting and Viewing Traces
Once you've applied the above commits and built and booted your image (you need to build the core-image-sato-sdk image or the other methods described in the General Setup section), you're ready to start tracing.
Collecting and viewing a trace on the target (inside a shell)
First, from the target, ssh to the target:
$ ssh -l root 192.168.1.47
The authenticity of host '192.168.1.47 (192.168.1.47)' can't be established.
RSA key fingerprint is 23:bd:c8:b1:a8:71:52:00:ee:00:4f:64:9e:10:b9:7e.
Are you sure you want to continue connecting (yes/no)? yes
Warning: Permanently added '192.168.1.47' (RSA) to the list of known hosts.
root@192.168.1.47's password:
Once on the target, use these steps to create a trace:
root@crownbay:~# lttng create
Spawning a session daemon
Session auto-20121015-232120 created.
Traces will be written in /home/root/lttng-traces/auto-20121015-232120
Enable the events you want to trace (in this case all kernel events):
root@crownbay:~# lttng enable-event --kernel --all
All kernel events are enabled in channel channel0
Start the trace:
root@crownbay:~# lttng start
Tracing started for session auto-20121015-232120
And then stop the trace after awhile or after running a particular workload that you want to trace:
root@crownbay:~# lttng stop
Tracing stopped for session auto-20121015-232120
You can now view the trace in text form on the target:
root@crownbay:~# lttng view
[23:21:56.989270399] (+?.?????????) sys_geteuid: { 1 }, { }
[23:21:56.989278081] (+0.000007682) exit_syscall: { 1 }, { ret = 0 }
[23:21:56.989286043] (+0.000007962) sys_pipe: { 1 }, { fildes = 0xB77B9E8C }
[23:21:56.989321802] (+0.000035759) exit_syscall: { 1 }, { ret = 0 }
[23:21:56.989329345] (+0.000007543) sys_mmap_pgoff: { 1 }, { addr = 0x0, len = 10485760, prot = 3, flags = 131362, fd = 4294967295, pgoff = 0 }
[23:21:56.989351694] (+0.000022349) exit_syscall: { 1 }, { ret = -1247805440 }
[23:21:56.989432989] (+0.000081295) sys_clone: { 1 }, { clone_flags = 0x411, newsp = 0xB5EFFFE4, parent_tid = 0xFFFFFFFF, child_tid = 0x0 }
[23:21:56.989477129] (+0.000044140) sched_stat_runtime: { 1 }, { comm = "lttng-consumerd", tid = 1193, runtime = 681660, vruntime = 43367983388 }
[23:21:56.989486697] (+0.000009568) sched_migrate_task: { 1 }, { comm = "lttng-consumerd", tid = 1193, prio = 20, orig_cpu = 1, dest_cpu = 1 }
[23:21:56.989508418] (+0.000021721) hrtimer_init: { 1 }, { hrtimer = 3970832076, clockid = 1, mode = 1 }
[23:21:56.989770462] (+0.000262044) hrtimer_cancel: { 1 }, { hrtimer = 3993865440 }
[23:21:56.989771580] (+0.000001118) hrtimer_cancel: { 0 }, { hrtimer = 3993812192 }
[23:21:56.989776957] (+0.000005377) hrtimer_expire_entry: { 1 }, { hrtimer = 3993865440, now = 79815980007057, function = 3238465232 }
[23:21:56.989778145] (+0.000001188) hrtimer_expire_entry: { 0 }, { hrtimer = 3993812192, now = 79815980008174, function = 3238465232 }
[23:21:56.989791695] (+0.000013550) softirq_raise: { 1 }, { vec = 1 }
[23:21:56.989795396] (+0.000003701) softirq_raise: { 0 }, { vec = 1 }
[23:21:56.989800635] (+0.000005239) softirq_raise: { 0 }, { vec = 9 }
[23:21:56.989807130] (+0.000006495) sched_stat_runtime: { 1 }, { comm = "lttng-consumerd", tid = 1193, runtime = 330710, vruntime = 43368314098 }
[23:21:56.989809993] (+0.000002863) sched_stat_runtime: { 0 }, { comm = "lttng-sessiond", tid = 1181, runtime = 1015313, vruntime = 36976733240 }
[23:21:56.989818514] (+0.000008521) hrtimer_expire_exit: { 0 }, { hrtimer = 3993812192 }
[23:21:56.989819631] (+0.000001117) hrtimer_expire_exit: { 1 }, { hrtimer = 3993865440 }
[23:21:56.989821866] (+0.000002235) hrtimer_start: { 0 }, { hrtimer = 3993812192, function = 3238465232, expires = 79815981000000, softexpires = 79815981000000 }
[23:21:56.989822984] (+0.000001118) hrtimer_start: { 1 }, { hrtimer = 3993865440, function = 3238465232, expires = 79815981000000, softexpires = 79815981000000 }
[23:21:56.989832762] (+0.000009778) softirq_entry: { 1 }, { vec = 1 }
[23:21:56.989833879] (+0.000001117) softirq_entry: { 0 }, { vec = 1 }
[23:21:56.989838069] (+0.000004190) timer_cancel: { 1 }, { timer = 3993871956 }
[23:21:56.989839187] (+0.000001118) timer_cancel: { 0 }, { timer = 3993818708 }
[23:21:56.989841492] (+0.000002305) timer_expire_entry: { 1 }, { timer = 3993871956, now = 79515980, function = 3238277552 }
[23:21:56.989842819] (+0.000001327) timer_expire_entry: { 0 }, { timer = 3993818708, now = 79515980, function = 3238277552 }
[23:21:56.989854831] (+0.000012012) sched_stat_runtime: { 1 }, { comm = "lttng-consumerd", tid = 1193, runtime = 49237, vruntime = 43368363335 }
[23:21:56.989855949] (+0.000001118) sched_stat_runtime: { 0 }, { comm = "lttng-sessiond", tid = 1181, runtime = 45121, vruntime = 36976778361 }
[23:21:56.989861257] (+0.000005308) sched_stat_sleep: { 1 }, { comm = "kworker/1:1", tid = 21, delay = 9451318 }
[23:21:56.989862374] (+0.000001117) sched_stat_sleep: { 0 }, { comm = "kworker/0:0", tid = 4, delay = 9958820 }
[23:21:56.989868241] (+0.000005867) sched_wakeup: { 0 }, { comm = "kworker/0:0", tid = 4, prio = 120, success = 1, target_cpu = 0 }
[23:21:56.989869358] (+0.000001117) sched_wakeup: { 1 }, { comm = "kworker/1:1", tid = 21, prio = 120, success = 1, target_cpu = 1 }
[23:21:56.989877460] (+0.000008102) timer_expire_exit: { 1 }, { timer = 3993871956 }
[23:21:56.989878577] (+0.000001117) timer_expire_exit: { 0 }, { timer = 3993818708 }
.
.
.
You can now safely destroy the trace session (note that this doesn't delete the trace - it's still there in ~/lttng-traces):
root@crownbay:~# lttng destroy
Session auto-20121015-232120 destroyed at /home/root
Note that the trace is saved in a directory of the same name as returned by 'lttng create', under the ~/lttng-traces directory (note that you can change this by supplying your own name to 'lttng create'):
root@crownbay:~# ls -al ~/lttng-traces
drwxrwx---    3 root     root          1024 Oct 15 23:21 .
drwxr-xr-x    5 root     root          1024 Oct 15 23:57 ..
drwxrwx---    3 root     root          1024 Oct 15 23:21 auto-20121015-232120
Manually copying a trace to the host and viewing it in Eclipse (i.e. using Eclipse without network support)
If you already have an LTTng trace on a remote target and would like to view it in Eclipse on the host, you can easily copy it from the target to the host and import it into Eclipse to view it using the LTTng Eclipse plugin already bundled in the Eclipse (Juno SR1 or greater).
Using the trace we created in the previous section, archive it and copy it to your host system:
root@crownbay:~/lttng-traces# tar zcvf auto-20121015-232120.tar.gz auto-20121015-232120
auto-20121015-232120/
auto-20121015-232120/kernel/
auto-20121015-232120/kernel/metadata
auto-20121015-232120/kernel/channel0_1
auto-20121015-232120/kernel/channel0_0
$ scp root@192.168.1.47:lttng-traces/auto-20121015-232120.tar.gz .
root@192.168.1.47's password:
auto-20121015-232120.tar.gz                                             100% 1566KB   1.5MB/s   00:01
Unarchive it on the host:
$ gunzip -c auto-20121015-232120.tar.gz | tar xvf -
auto-20121015-232120/
auto-20121015-232120/kernel/
auto-20121015-232120/kernel/metadata
auto-20121015-232120/kernel/channel0_1
auto-20121015-232120/kernel/channel0_0
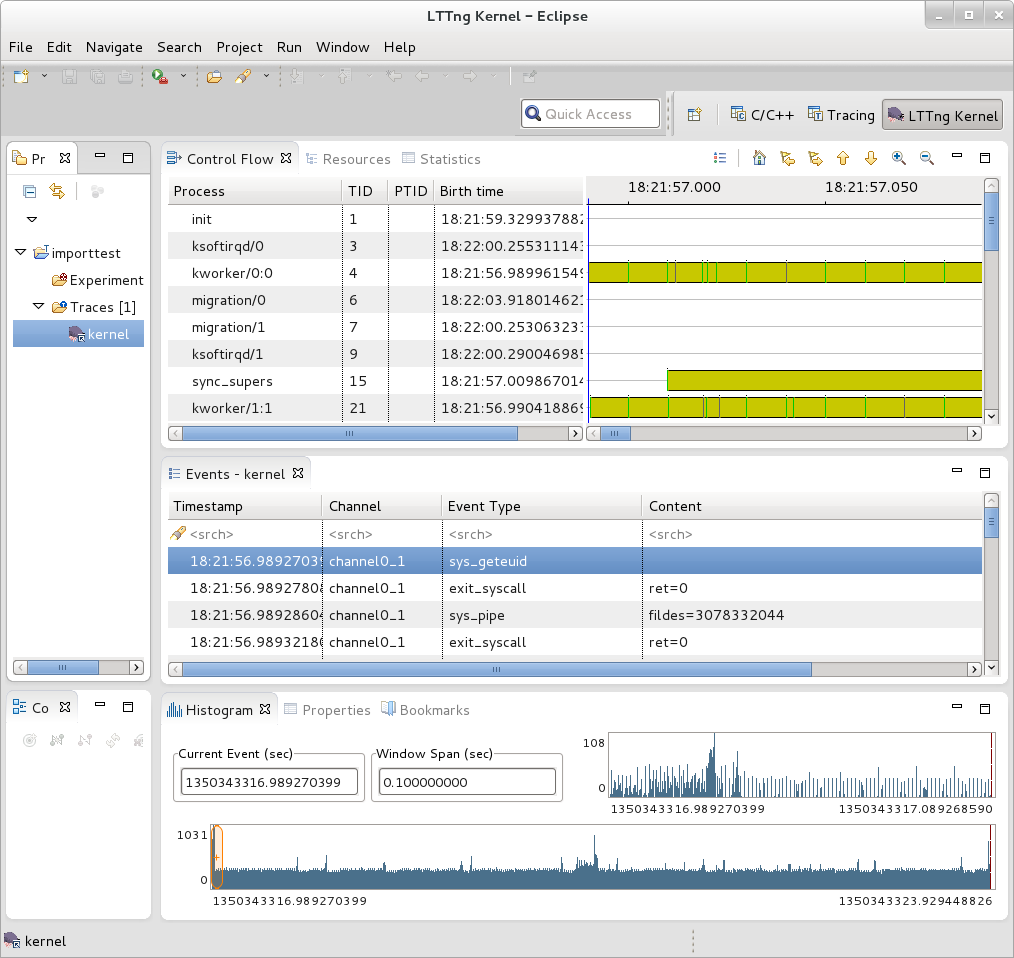
We can now import the trace into Eclipse and view it:
- First, start eclipse and open the 'LTTng Kernel' perspective by selecting the following menu item:
Window | Open Perspective | Other...
- In the dialog box that opens, select 'LTTng Kernel' from the list.
- Back at the main menu, select the following menu item:
File | New | Project...
- In the dialog box that opens, select the 'Tracing | Tracing Project' wizard and press 'Next>'.
- Give the project a name and press 'Finish'.
- In the 'Project Explorer' pane under the project you created, right click on the 'Traces' item.
- Select 'Import..." and in the dialog that's displayed:
- Browse the filesystem and find the select the 'kernel' directory containing the trace you copied from the target e.g. auto-20121015-232120/kernel
- 'Checkmark' the directory in the tree that's displayed for the trace
- Below that, select 'Common Trace Format: Kernel Trace' for the 'Trace Type'
- Press 'Finish' to close the dialog
- Back in the 'Project Explorer' pane, double-click on the 'kernel' item for the trace you just imported under 'Traces'
You should now see your trace data displayed graphically in several different views in Eclipse:
You can access extensive help information on how to use the LTTng plugin to search and analyze captured traces via the Eclipse help system:
Help | Help Contents | LTTng Plug-in User Guide
Collecting and viewing a trace in Eclipse
NOTE: This section on collecting traces remotely doesn't currently work because of Eclipse 'RSE' connectivity problems. Manually tracing on the target, copying the trace files to the host, and viewing the trace in Eclipse on the host as outlined in previous steps does work however - please use the manual steps outlined above to view traces in Eclipse.
In order to trace a remote target, you also need to add a 'tracing' group on the target and connect as a user who's part of that group e.g:
# adduser tomz
# groupadd -r tracing
# usermod -a -G tracing tomz
- First, start eclipse and open the 'LTTng Kernel' perspective by selecting the following menu item:
Window | Open Perspective | Other...
- In the dialog box that opens, select 'LTTng Kernel' from the list.
- Back at the main menu, select the following menu item:
File | New | Project...
- In the dialog box that opens, select the 'Tracing | Tracing Project' wizard and press 'Next>'.
- Give the project a name and press 'Finish'.
That should result in an entry in the 'Project' subwindow.
- In the 'Control' subwindow just below it, press 'New Connection'.
- Add a new connection, giving it the hostname or IP address of the target system.
Also provide the username and password of a qualified user (a member of the 'tracing' group) or root account on the target system.
Also, provide appropriate answers to whatever else is asked for e.g. 'secure storage password' can be anything you want
If you get an 'RSE Error' it may be due to proxies. It may be possible to get around the problem by changing the following setting:
Window | Preferences | Network Connections
Switch 'Active Provider' to 'Direct'
blktrace
blktrace is a tool for tracing and reporting low-level disk I/O. blktrace provides the tracing half of the equation; its output can be piped into the blkparse program, which renders the data in a human-readable form and does some basic analysis:
$ blktrace /dev/sda -o - | blkparse -i -
systemtap
SystemTap is a system-wide script-based tracing and profiling tool.
SystemTap scripts are C-like programs that are executed in the kernel to gather/print/aggregate data extracted from the context they end up being invoked under.
For example, this probe from the SystemTap tutorial [1] simply prints a line every time any process on the system open()s a file. For each line, it prints the executable name of the program that opened the file, along with its pid, and the name of the file it opened (or tried to open), which it extracts from the open syscall's argstr.
probe syscall.open
{
        printf ("%s(%d) open (%s)\n", execname(), pid(), argstr)
}

probe timer.ms(4000) # after 4 seconds
{
        exit ()
}
Normally, to execute this probe, you'd simply install systemtap on the system you want to probe, and directly run the probe on that system e.g. assuming the name of the file containing the above text is trace_open.stp:
# stap trace_open.stp
What systemtap does under the covers to run this probe is 1) parse and convert the probe to an equivalent 'C' form, 2) compile the 'C' form into a kernel module, 3) insert the module into the kernel, which arms it, and 4) collect the data generated by the probe and display it to the user.
In order to accomplish steps 1 and 2, the 'stap' program needs access to the kernel build system that produced the kernel that the probed system is running. In the case of a typical embedded system (the 'target'), the kernel build system unfortunately isn't typically part of the image running on the target. It is normally available on the 'host' system that produced the target image however; in such cases, steps 1 and 2 are executed on the host system, and steps 3 and 4 are executed on the target system, using only the systemtap 'runtime'.
The systemtap support in Yocto assumes that only steps 3 and 4 are run on the target; it is possible to do everything on the target, but this section assumes only the typical embedded use-case.
So basically what you need to do in order to run a systemtap script on the target is to 1) on the host system, compile the probe into a kernel module that makes sense to the target, 2) copy the module onto the target system and 3) insert the module into the target kernel, which arms it, and 4) collect the data generated by the probe and display it to the user.
Setup
Those are a lot of steps and a lot of details, but fortunately Yocto includes a script called 'crosstap' that will take care of those details, allowing you to simply execute a systemtap script on the remote target, with arguments if necessary.
In order to do this from a remote host, however, you need to have access to the build for the image you booted. The 'crosstap' script provides details on how to do this if you run the script on the host without having done a build:
$ crosstap root@192.168.1.88 trace_open.stp

Error: No target kernel build found.
Did you forget to create a local build of your image?

'crosstap' requires a local sdk build of the target system
(or a build that includes 'tools-profile') in order to build
kernel modules that can probe the target system.

Practically speaking, that means you need to do the following:
 - If you're running a pre-built image, download the release
   and/or BSP tarballs used to build the image.
 - If you're working from git sources, just clone the metadata
   and BSP layers needed to build the image you'll be booting.
 - Make sure you're properly set up to build a new image (see
   the BSP README and/or the widely available basic documentation
   that discusses how to build images).
 - Build an -sdk version of the image e.g.:
     $ bitbake core-image-sato-sdk
 OR
 - Build a non-sdk image but include the profiling tools:
     [ edit local.conf and add 'tools-profile' to the end of
       the EXTRA_IMAGE_FEATURES variable ]
     $ bitbake core-image-sato

 [ NOTE that 'crosstap' needs to be able to ssh into the target
   system, which isn't enabled by default in -minimal images. ]

Once you've build the image on the host system, you're ready to
boot it (or the equivalent pre-built image) and use 'crosstap'
to probe it (you need to source the environment as usual first):

   $ source oe-init-build-env
   $ cd ~/my/systemtap/scripts
   $ crosstap root@192.168.1.xxx myscript.stp
So essentially what you need to do is build an SDK image or image with 'tools-profile' as detailed in the 'General Setup' section of this wiki, and boot the resulting target image.
NOTE: if you have a build directory containing multiple machines, you need to have the MACHINE you're connecting to selected in local.conf, and the kernel in that machine's build directory must match the kernel on the booted system exactly, or you'll get the above 'crosstap' message when you try to invoke a script.
Running a script on the target
Once you've done that, you should be able to run a systemtap script on the target:
$ cd /path/to/yocto
$ source oe-init-build-env
### Shell environment set up for builds. ###

You can now run 'bitbake <target>'

Common targets are:
   core-image-minimal
   core-image-sato
   meta-toolchain
   meta-toolchain-sdk
   adt-installer
   meta-ide-support

You can also run generated qemu images with a command like 'runqemu qemux86'
Once you've done that, you can cd to whatever directory contains your scripts and use 'crosstap' to run the script:
$ cd /path/to/my/systemap/script
$ crosstap root@192.168.7.2 trace_open.stp
If you get an error connecting to the target e.g.:
$ crosstap root@192.168.7.2 trace_open.stp
error establishing ssh connection on remote 'root@192.168.7.2'
Try ssh'ing to the target and see what happens:
$ ssh root@192.168.7.2
A lot of the time, connection problems are due specifying a wrong IP address or having a 'host key verification error'.
If everything worked as planned, you should see something like this (enter the password when prompted, or press enter if its set up to use no password):
$ crosstap root@192.168.7.2 trace_open.stp
root@192.168.7.2's password:
matchbox-termin(1036) open ("/tmp/vte3FS2LW", O_RDWR|O_CREAT|O_EXCL|O_LARGEFILE, 0600)
matchbox-termin(1036) open ("/tmp/vteJMC7LW", O_RDWR|O_CREAT|O_EXCL|O_LARGEFILE, 0600)
