TipsAndTricks/DebuggingBitbakeInPudb
How to debug bitbake itself with pudb
I recently had the need to debug bitbake and toaster to figure out why toaster was no longer able to save event information to it's database.
It turned out that I wanted to step through a number of the lib/bb/* files to see how the server was being setup.
What I did
. ./poky/oe-init-build-env
. toaster start webport=0.0.0.0:8000
This set up the toaster webserver to run.
Then my debug test:
python3 -m pudb.run $(which bitbake) quilt-native
I was looking at changes to bitbake/lib/bb/main.py. So, in that file I could set up breakpoints in code like so:
from pudb import set_trace as bp
...
...
bp()
...
...
This allows me to sprinkle programmatic breakpoints wherever I want. If you have a better/preferred way to step through bitbake, feel free to add/change this document.
Debugging python in metadata with pudb
Now, this is kinda out there but you can do it.
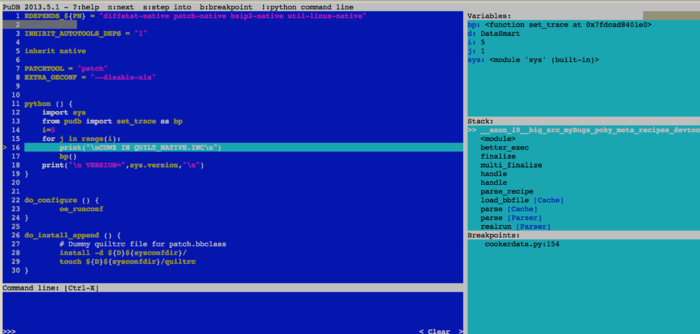
My example is definitely a tad contrived but here goes. Suppose you want to see the state of things in the pudb debugger from a .inc file. As our example let's put the following at the top of quilt-native.inc, just after the line EXTRA_OECONF = "--disable-nls":
python () {
   import sys
   from pudb import set_trace as bp
   i=5
   for j in range(i):
       print("\nCOWZ IN QUILT_NATIVE.INC\n")
       bp()
   print("\n VERSION=",sys.version,"\n")
}
If I then run
python3 -m pudb.run $(which bitbake) quilt-native
I will break in the python in the metadata and be able to stop through it and watch j=0,1,... up to 4. Looks like this:
