Build Performance: Difference between revisions
mNo edit summary |
No edit summary |
||
| Line 34: | Line 34: | ||
If you enable buildstats (by adding <tt>INHERIT += "buildstats"</tt> to local.conf) you will get detailed build performance log data in tmp/buildstats. | If you enable buildstats (by adding <tt>INHERIT += "buildstats"</tt> to local.conf) you will get detailed build performance log data in tmp/buildstats. | ||
Richard Purdie has [https://lists.yoctoproject.org/pipermail/poky/2011-February/003740.html modified pybootbootchartgui] to parse this data and produce pretty charts | Richard Purdie has [https://lists.yoctoproject.org/pipermail/poky/2011-February/003740.html modified pybootbootchartgui] to parse this data and produce [http://tim.rpsys.net/bootchart.png pretty charts]. | ||
== parallelism == | == parallelism == | ||
Revision as of 07:26, 19 April 2012
This page is intended to serve as a guide to tweaking your build system and bitbake configuration for optimal build time as well as to provide some guidance on how to collect build metrics and identify bottlenecks.
General Tips
Some general tips on how to ensure good performance of builds:
- Put the build directory on its own disk. This is good practice in its own right since the build system has a tendency to wear disks heavily.
- Use the ext4 filesystem for the build disk
- Turn off journaling for ext4 ("tune2fs -O ^has_journal <disk>")
- Mount using the options "noatime,barrier=0,commit=6000"
- Use a tmpfs for /tmp
bb-matrix
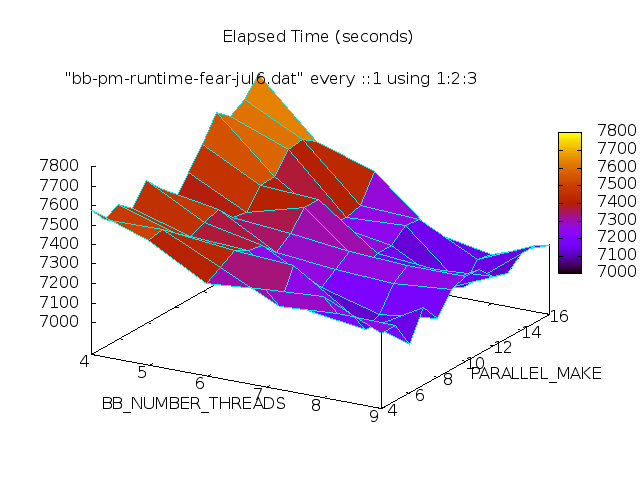
The bb-matrix.sh script (scripts/contrib/bb-perf) can be used to collect all the relevant metrics of the TIME(1) command for a build. The bb-matrix.sh generates a datfile similar to the following (trimmed for display purposes):
BB PM %e %S %U %P %c %w %R %F %M
04 04 7584.13 3106.60 19818.78 302% 10038479 53837200 2381052920 52972 1857632
04 05 7488.93 3143.40 20344.21 313% 10290920 53308215 2380549395 51668 2027232
04 06 7524.69 3141.34 20575.58 315% 10287288 53626500 2380333579 51820 2027248
04 07 7464.62 3141.47 20741.94 319% 10613016 53459858 2381025909 50929 2027376
04 08 7570.45 3151.23 20949.85 318% 10625744 53485726 2382061127 52367 2027232
05 04 7479.95 3254.95 20444.40 316% 13858856 50054205 2387500546 53457 2027232
05 05 7494.82 3282.37 20643.16 319% 14274000 49852477 2380346993 52289 2027248
05 06 7432.55 3277.54 21049.68 327% 14340685 49998524 2380221845 53622 2027376
05 07 7377.66 3300.18 21238.96 332% 13926958 50634688 2384699997 53851 1941840
05 08 7408.57 3297.64 21306.12 332% 14139864 50330053 2380869210 54169 1912272
The bb-matrix-plot.sh script can then be used to visualize this data, generating images like the following:
buildstats
If you enable buildstats (by adding INHERIT += "buildstats" to local.conf) you will get detailed build performance log data in tmp/buildstats.
Richard Purdie has modified pybootbootchartgui to parse this data and produce pretty charts.
parallelism
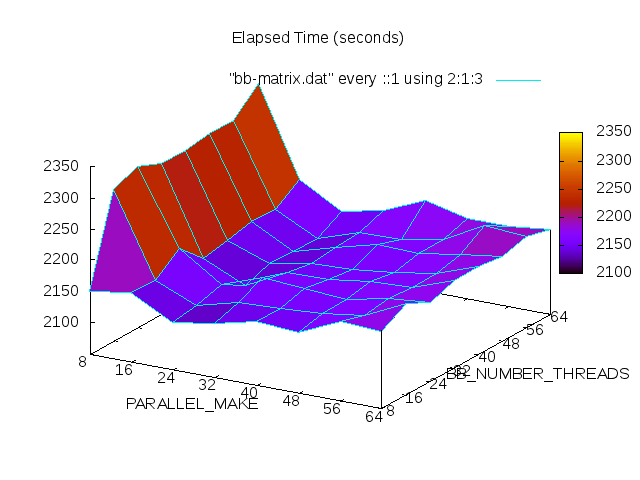
Small builds do not scale to a large number of cores, due to package inter-dependencies. Going far beyond 8 is not giving much benefit. Here is a graph of a 64-core machine building core-image-minimal with different build parameters:
Bigger builds are less hampered by linear dependency chains, and fill the cores better.
discussion
Build system performance is a recurring mailing list topic. Here is Richard Purdie discussing the challenges of improving many-core build performance and package dependency issues.

