Yocto Bug Trend: Difference between revisions
From Yocto Project
Jump to navigationJump to search
No edit summary |
No edit summary |
||
| Line 1: | Line 1: | ||
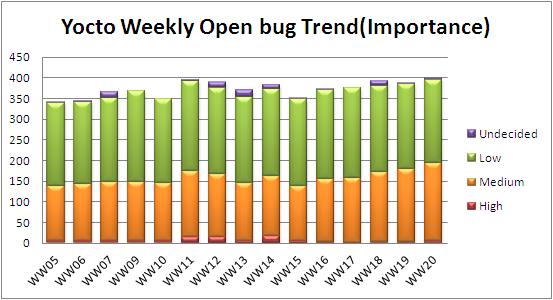
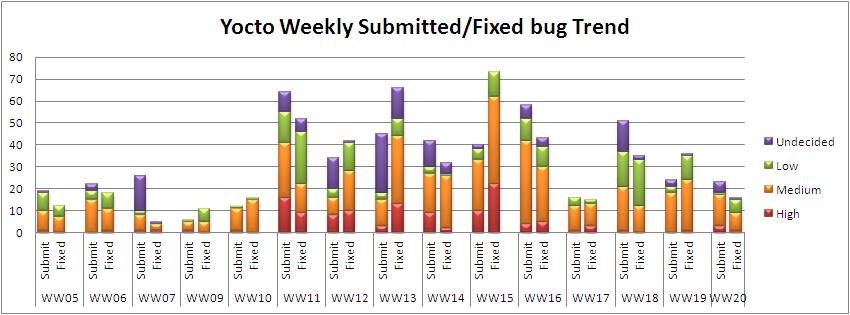
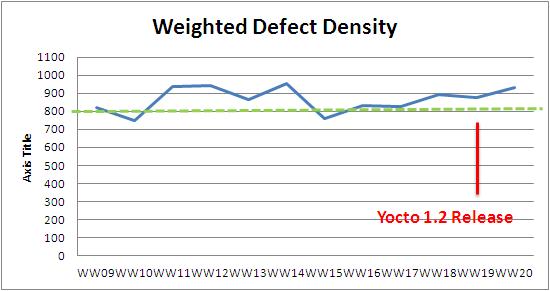
This page is to show latest Yocto Project bug trend status. 3 charts are included. The 1st chart indicates the total open bug number. The 2nd chart indicates the new bug submission and bug fixing count every week. The 3rd chart is the sum of weights for all open bugs. | |||
=== Open Bug Trend === | |||
[[File:WW20_open_bug_trend.JPG]] | [[File:WW20_open_bug_trend.JPG]] | ||
=== New Submitted and Fixed Bug number === | |||
[[File:WW20_submitted_fixed_bug_trend.JPG]] | |||
=== Weighted Defect Density for Open Bug === | |||
[[File:WW20_weighted_defect_density.JPG]] | [[File:WW20_weighted_defect_density.JPG]] | ||
Revision as of 14:09, 17 May 2011
This page is to show latest Yocto Project bug trend status. 3 charts are included. The 1st chart indicates the total open bug number. The 2nd chart indicates the new bug submission and bug fixing count every week. The 3rd chart is the sum of weights for all open bugs.


