Vmstat: Difference between revisions
From Yocto Project
Jump to navigationJump to search
No edit summary |
No edit summary |
||
| Line 1: | Line 1: | ||
=System | =System monitoring with vmstat= | ||
The following results were obtained based on data collected using <tt>vmstat</tt>, a tool that reports a system's virtual memory statistics. | The following results were obtained based on data collected using <tt>vmstat</tt>, a tool that reports a system's virtual memory statistics. In order to reproduce the output shown in section 2, one should: | ||
In order to reproduce the output shown | |||
* Fetch upstream code from the <tt>core-image-minimal</tt> recipes | * Fetch upstream code from the <tt>core-image-minimal</tt> recipes | ||
| Line 12: | Line 10: | ||
$ bitbake core-image-minimal -c fetchall | $ bitbake core-image-minimal -c fetchall | ||
* Start vmstat in | * Start vmstat in a new terminal (set a 2 sec interval) | ||
$ vmstat 2 > vmstat-output.raw | $ vmstat 2 > vmstat-output.raw | ||
* On the | * On the terminal from the first step, launch bitbake, making sure no network activity will be done | ||
$ echo -e 'BB_NO_NETWORK = "1"' >> conf/auto.conf | $ echo -e 'BB_NO_NETWORK = "1"' >> conf/auto.conf | ||
$ bitbake core-image-minimal | $ bitbake core-image-minimal | ||
* Once <tt>bitbake</tt> finishes, <tt>Ctrl+D</tt> the <tt>vmstat</tt> command | * Once <tt>bitbake</tt> finishes, <tt>Ctrl+D</tt> the <tt>vmstat</tt> command to stop it | ||
=== | =Vmstat output= | ||
== Processing jobs== | |||
Procs | Procs | ||
r: The number of runnable processes (running or waiting for run time). | r: The number of runnable processes (running or waiting for run time). | ||
b: The number of processes in uninterruptible sleep. | b: The number of processes in uninterruptible sleep. | ||
[[File:Vmstat-procs-minimal.png|thumb|center|500px]] | [[File:Vmstat-procs-minimal.png|thumb|center|500px|Test|Test2]] | ||
== Memory usage== | |||
Memory | Memory | ||
swpd: the amount of virtual memory used. | swpd: the amount of virtual memory used. | ||
| Line 33: | Line 32: | ||
cache: the amount of memory used as cache. | cache: the amount of memory used as cache. | ||
[[File:Vmstat-memory-minimal.png|thumb|center|500px]] | [[File:Vmstat-memory-minimal.png|thumb|center|500px]] | ||
== IO activity== | |||
IO | IO | ||
bi: Blocks received from a block device (blocks/s). | bi: Blocks received from a block device (blocks/s). | ||
bo: Blocks sent to a block device (blocks/s). | bo: Blocks sent to a block device (blocks/s). | ||
[[File:Vmstat-io-minimal.png|thumb|center|500px]] | [[File:Vmstat-io-minimal.png|thumb|center|500px]] | ||
== System operations== | |||
System | System | ||
in: The number of interrupts per second, including the clock. | in: The number of interrupts per second, including the clock. | ||
cs: The number of context switches per second. | cs: The number of context switches per second. | ||
[[File:Vmstat-system-minimal.png|thumb|center|500px]] | [[File:Vmstat-system-minimal.png|thumb|center|500px]] | ||
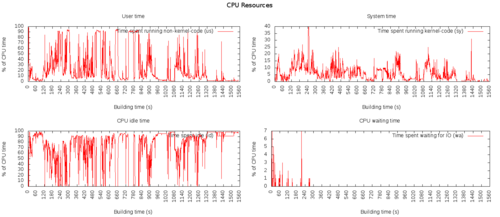
== CPU performance== | |||
CPU | CPU | ||
These are percentages of total CPU time. | These are percentages of total CPU time. | ||
Revision as of 18:49, 7 March 2017
System monitoring with vmstat
The following results were obtained based on data collected using vmstat, a tool that reports a system's virtual memory statistics. In order to reproduce the output shown in section 2, one should:
- Fetch upstream code from the core-image-minimal recipes
$ git clone git://git.yoctoproject.org/poky
$ cd poky/
$ source oe-init-build-env
$ echo -e 'DL_DIR = "/home/user/poky/downloads"' > conf/auto.conf
$ bitbake core-image-minimal -c fetchall
- Start vmstat in a new terminal (set a 2 sec interval)
$ vmstat 2 > vmstat-output.raw
- On the terminal from the first step, launch bitbake, making sure no network activity will be done
$ echo -e 'BB_NO_NETWORK = "1"' >> conf/auto.conf
$ bitbake core-image-minimal
- Once bitbake finishes, Ctrl+D the vmstat command to stop it
Vmstat output
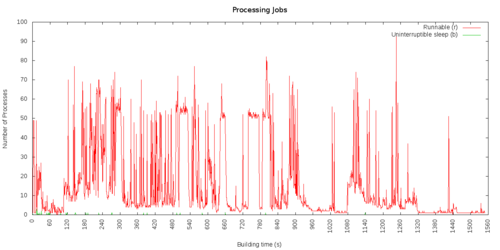
Processing jobs
  Procs
      r: The number of runnable processes (running or waiting for run time).
      b: The number of processes in uninterruptible sleep.
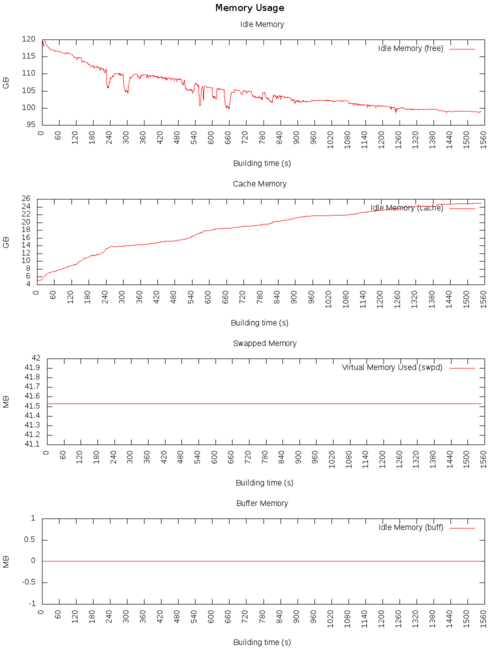
Memory usage
  Memory
      swpd: the amount of virtual memory used.
      free: the amount of idle memory.
      buff: the amount of memory used as buffers.
      cache: the amount of memory used as cache.
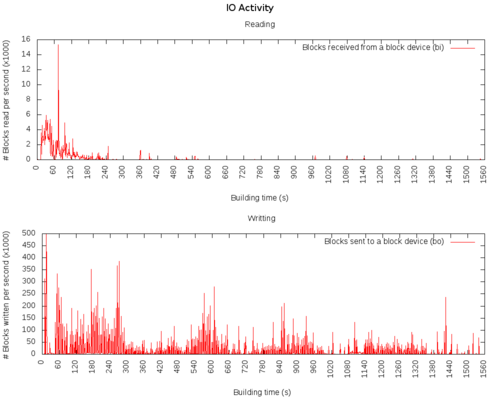
IO activity
  IO
      bi: Blocks received from a block device (blocks/s).
      bo: Blocks sent to a block device (blocks/s).
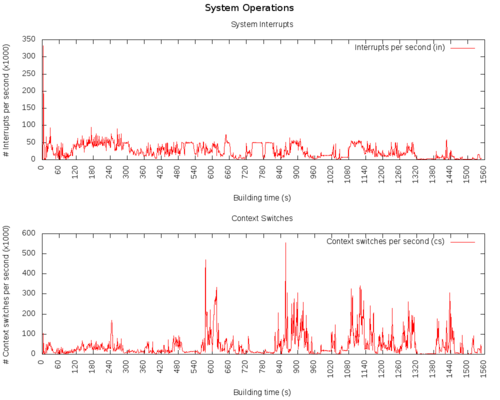
System operations
  System
      in: The number of interrupts per second, including the clock.
      cs: The number of context switches per second.
CPU performance
  CPU
      These are percentages of total CPU time.
      us: Time spent running non-kernel code.  (user time, including nice time)
      sy: Time spent running kernel code.  (system time)
      id: Time spent idle.  Prior to Linux 2.5.41, this includes IO-wait time.
      wa: Time spent waiting for IO.  Prior to Linux 2.5.41, included in idle.
      st: Time stolen from a virtual machine.  Prior to Linux 2.6.11, unknown.
