TipsAndTricks/InvestigatingBuildTime: Difference between revisions
No edit summary |
No edit summary |
||
| Line 60: | Line 60: | ||
=== Results === | === Results === | ||
==== Time Results ==== | |||
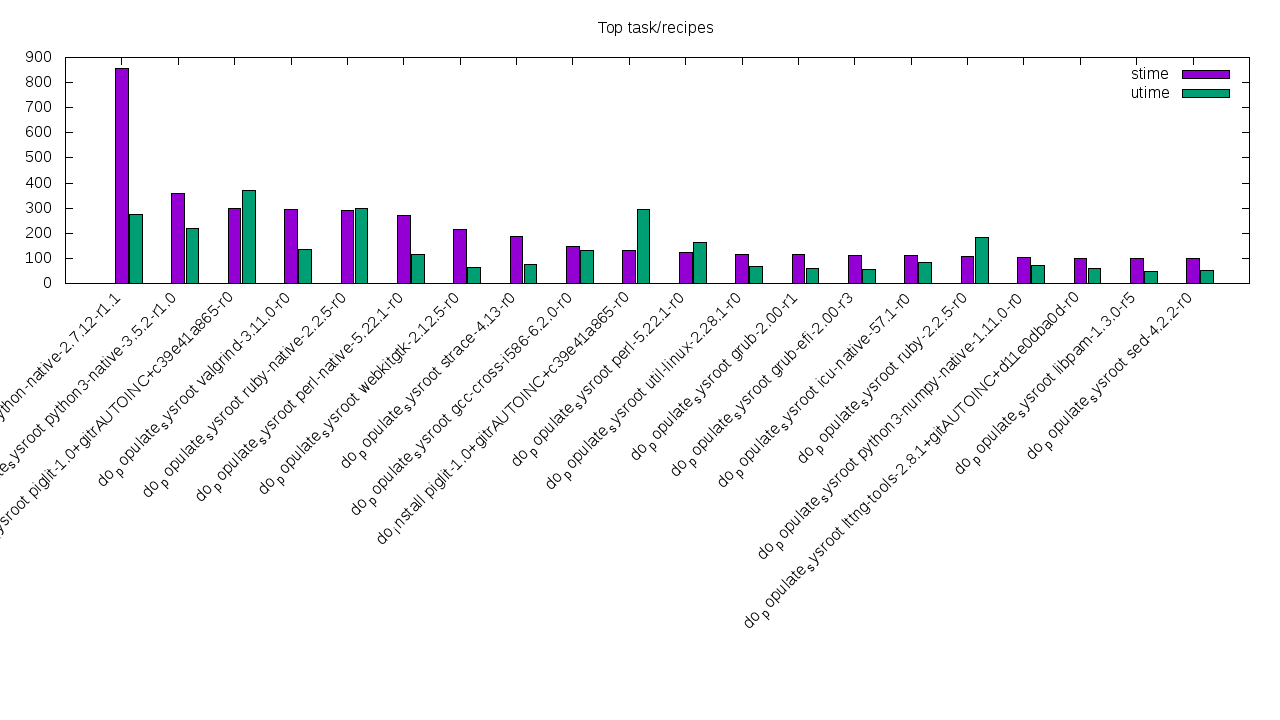
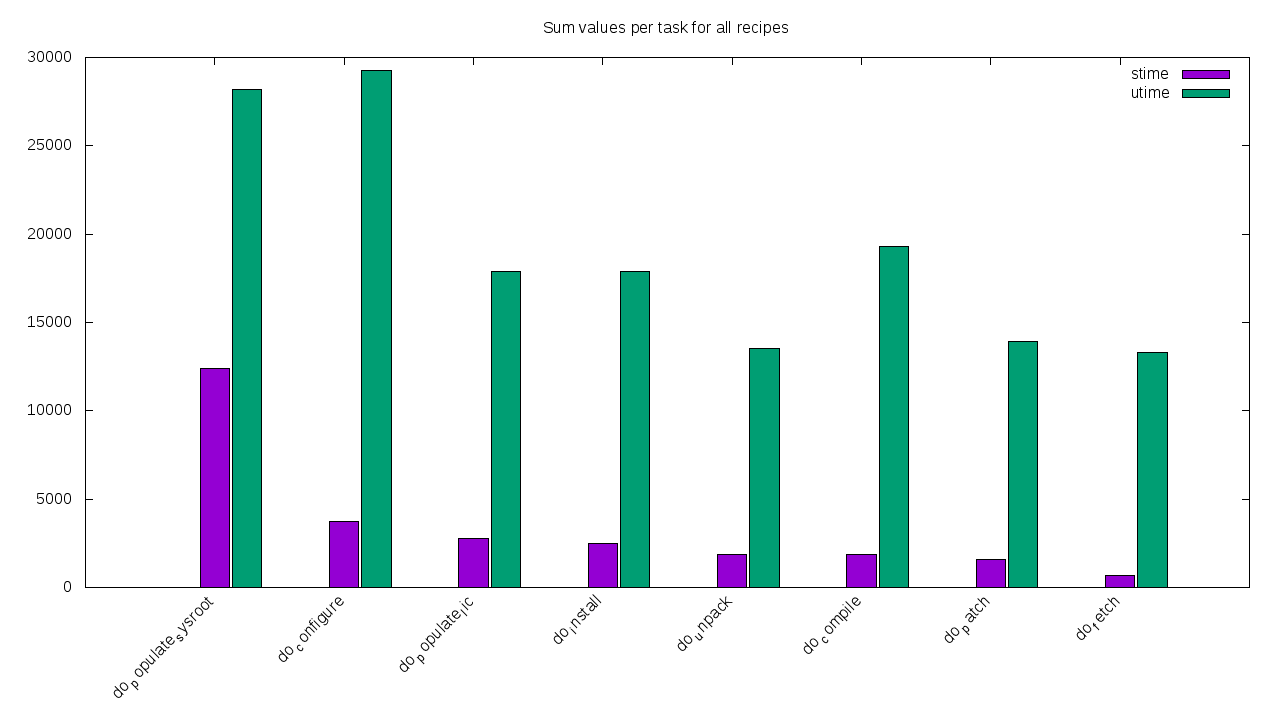
bsplots "stime:utime" | bsplots "stime:utime" | ||
[[File:Stime-utime.task-recipe.png]] | |||
[[File:Stime-utime.task.png]] | |||
==== IO Results ==== | |||
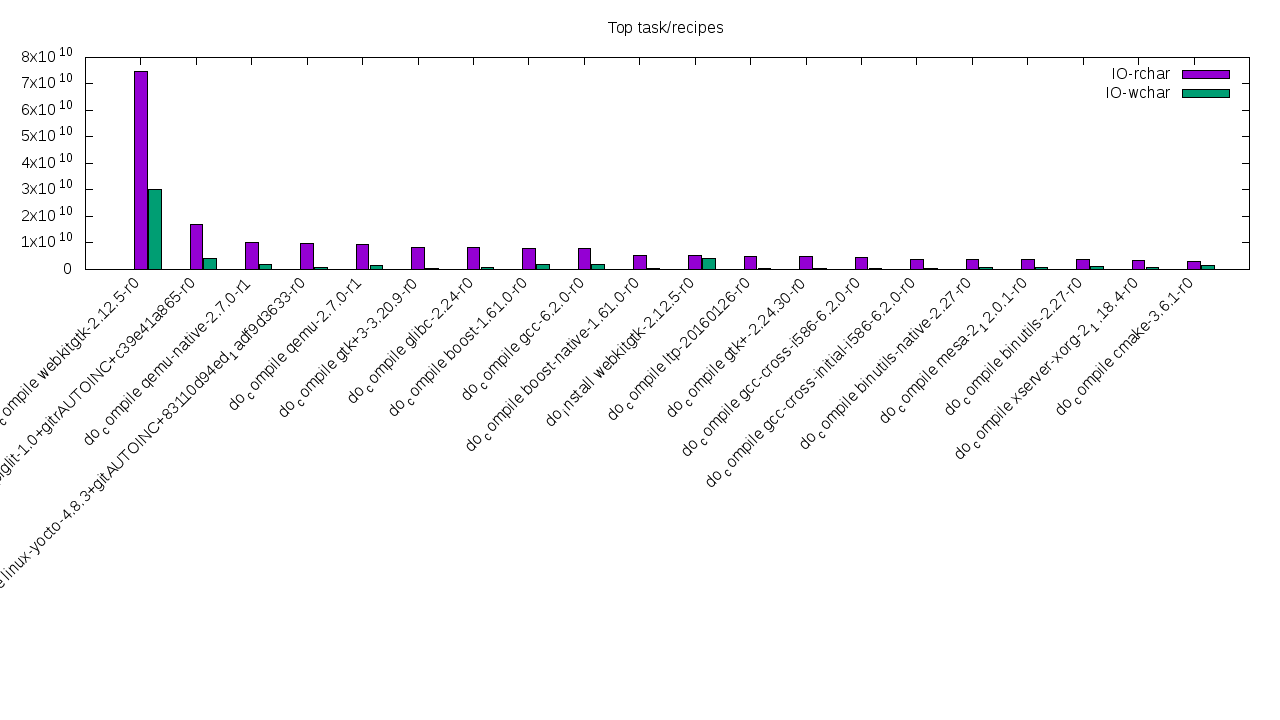
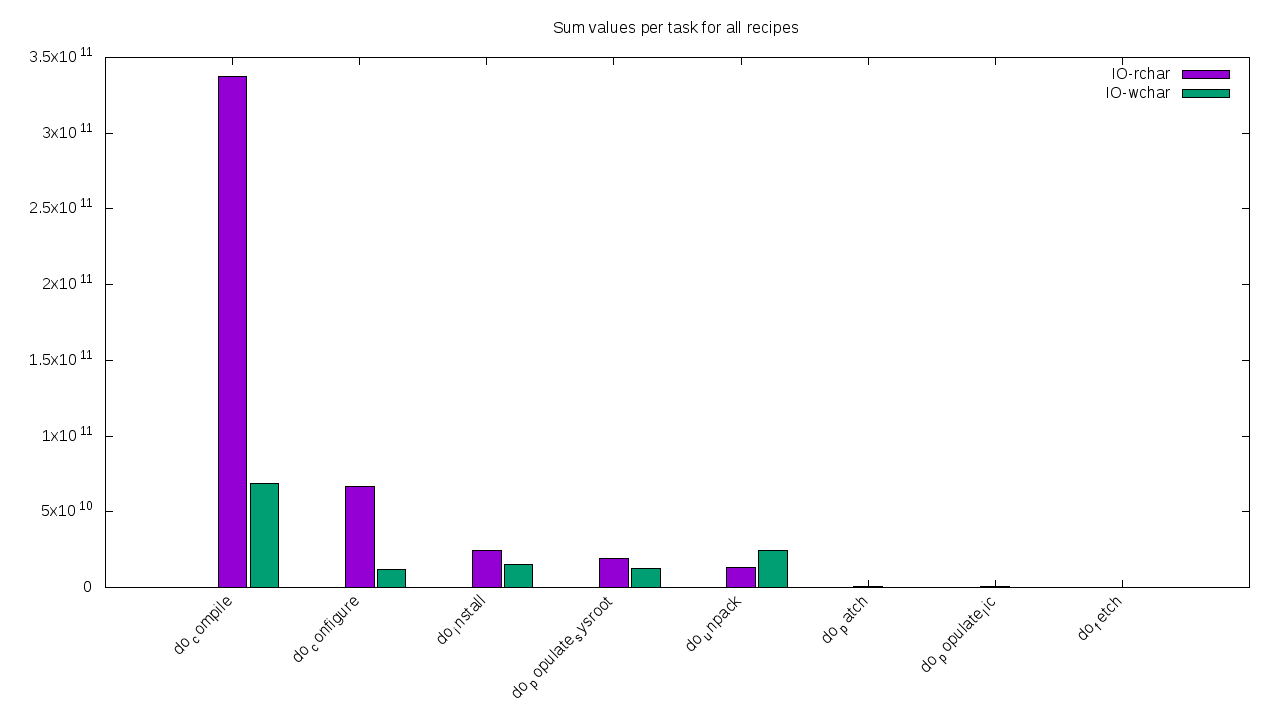
bsplots "IO rchar:IO wchar" | bsplots "IO rchar:IO wchar" | ||
[[File:IOrchar-IOwchar.task-recipe.png]] | |||
[[File:IOrchar-IOwchar.task.png]] | |||
Revision as of 00:24, 15 November 2016
Draft: Investigating Build Time
(Placeholder. Demonstrate use of buildstats and pybootchartgui)
Current status: The intention is to use the scripts under scripts/contrib/bb-perf to parse buildstat data and produce useful plots.
The buildstats data produce by the class with the same name if included in USER_CLASSES variable
provides process statistics for every task. This data can offer insight of the time spent by the builder (bitbake) when
constructing a particular target at process level. This article focus more on profiling than optimization, the former being
the base for the latter.
Setup
 $ cd poky
 $ git checkout -b morty origin/morty
 $ . oe-init-build-env
 $ bitbake world
Buildstats
buildstats.bbclass stores mainly two set of process' stats: time and IO stats. For the moment, we are currently focusing on the following time data:
- /proc/[pid]/stat: utime, stime
- /proc/[pid]/stat: cutime, cstime
- python resource module: rusage ru_utime, rusage ru_stime
- python resource module: Child rusage ru_utime, Child rusage ru_stime
and the IO stats:
- /proc/[pid]/io: IO rchar, IO wchar
- /proc/[pid]/io: IO read_bytes, IO write_bytes
With this data, the following script (once the bitbake world command has finished) is used
to either plot the top N recipes-task stat values
$ ../scripts/contrib/bb-perf/buildstats-plot.sh -s <BUILDSTATS> -N $N | gnuplot -p
or sum all stats for a particular task for all (world) recipes
$ ../scripts/contrib/bb-perf/buildstats-plot.sh -s <BUILDSTATS> -S | gnuplot -p
The former produces a more granular plot and second a more general idea where the type is spent per task set.
Setup
GPLIMAGE='set terminal png fontscale 1 size 1280,720'
function bsplots() {
  local STAT=$1
  OUT="set output '$STAT.task-recipe.png'"
  ../scripts/contrib/bb-perf/buildstats-plot.sh -s "$STAT" -n 20 > input.gpl
  gnuplot -e "$GPLIMAGE;$OUT" input.gpl
  OUT="set output '$STAT.task.png'"
  ../scripts/contrib/bb-perf/buildstats-plot.sh -s "$STAT" -S > input.gpl
  gnuplot -e "$GPLIMAGE;$OUT" input.gpl
}
Results
Time Results
bsplots "stime:utime"
IO Results
bsplots "IO rchar:IO wchar"


