Yocto Bug Trend: Difference between revisions
(ww36) |
(update ww37) |
||
| Line 1: | Line 1: | ||
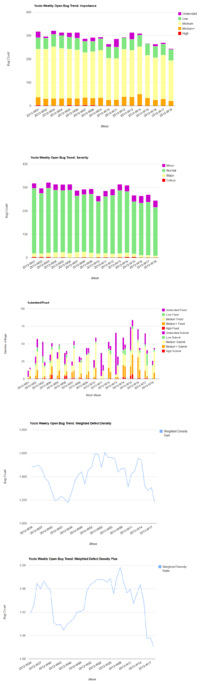
This page is to show latest Yocto Project bug trend status. 5 main charts and 1 detail chart are included. The first and second charts indicate the total open bug number by importance and severity. The third chart indicates the new bug submission and bug fixing count every week. The fourth chart is the sum of weights for all open bugs and the fifth one represents the report of the wdd over the total number of bugs. | This page is to show latest Yocto Project bug trend status. 5 main charts and 1 detail chart are included. The first and second charts indicate the total open bug number by importance and severity. The third chart indicates the new bug submission and bug fixing count every week. The fourth chart is the sum of weights for all open bugs and the fifth one represents the report of the wdd over the total number of bugs. | ||
The weighted defect density increased from last week's | The weighted defect density increased from last week's 1700 to 1770, the report of wdd over the total number of bugs - (wdd plus) decreased from 4.970 to 4.957. | ||
Chart data is now gathered automatically and displayed using detailed interactive charts. Hover your mouse over various parts of the charts for more detail. The dynamic axis labels will sometimes omit text for readability but the relevant data is displayed in the chart. | Chart data is now gathered automatically and displayed using detailed interactive charts. Hover your mouse over various parts of the charts for more detail. The dynamic axis labels will sometimes omit text for readability but the relevant data is displayed in the chart. | ||
=== Bug status of | === Bug status of WW37 === | ||
Please click through to view the charts. [[File:2013-05-06_WW18.png|200px|thumb|right|link=https://wiki.yoctoproject.org/charts/combo.html]] | Please click through to view the charts. [[File:2013-05-06_WW18.png|200px|thumb|right|link=https://wiki.yoctoproject.org/charts/combo.html]] | ||
Revision as of 15:56, 17 September 2013
This page is to show latest Yocto Project bug trend status. 5 main charts and 1 detail chart are included. The first and second charts indicate the total open bug number by importance and severity. The third chart indicates the new bug submission and bug fixing count every week. The fourth chart is the sum of weights for all open bugs and the fifth one represents the report of the wdd over the total number of bugs. The weighted defect density increased from last week's 1700 to 1770, the report of wdd over the total number of bugs - (wdd plus) decreased from 4.970 to 4.957.
Chart data is now gathered automatically and displayed using detailed interactive charts. Hover your mouse over various parts of the charts for more detail. The dynamic axis labels will sometimes omit text for readability but the relevant data is displayed in the chart.
Bug status of WW37
Please click through to view the charts.
Open Bug Trend by Importance
Importance - Display by day, filter by range + data table
Open Bug Trend by Severity - Enhancement and Janitors bug not included
New Submitted and Fixed Bug number
Weighted Defect Density for Opened Bugs - Enhancement and Janitors bug not included
Note: How we calculate the data of "weighted defect density"? We define a weight for each severity. And the sum of these weights for all open bugs are the data we record in chart. The weight we use for each severity: Critical:10, Major:7, Normal:5, Minor:3, Enhancement:0, Janitors:0
Basic Weighted Defect Density or Advanced Weighted Defect Density (requires flash)
Weighted Defect Density for Opened Bugs pondered by the total number of bugs
Basic Weighted Defect Density Plus! or Advanced Weighted Defect Density Plus! (requires flash)