Vmstat
System monitoring with vmstat
The following results were obtained based on data collected using vmstat, a tool that reports a system's virtual memory statistics.
These plots were produced using the scripts located on the bb-perf repository.
System Characteristics
Distro
CentOS Linux release 7.3.1611 (Core)
Linux version 3.10.0-514.6.1.el7.x86_64 (builder@kbuilder.dev.centos.org) (gcc version 4.8.5 20150623 (Red Hat 4.8.5-11) (GCC) ) #1 SMP Wed Jan 18 13:06:36 UTC 2017
RAM
MemTotal:       131814472 kB
MemFree:        70067576 kB
MemAvailable:   127241460 kB
Processor
Architecture:          x86_64
CPU op-mode(s):        32-bit, 64-bit
Byte Order:            Little Endian
CPU(s):                48
On-line CPU(s) list:   0-47
Thread(s) per core:    2
Core(s) per socket:    12
Socket(s):             2
NUMA node(s):          2
Vendor ID:             GenuineIntel
CPU family:            6
Model:                 62
Model name:            Intel(R) Xeon(R) CPU E5-2697 v2 @ 2.70GHz
Stepping:              4
CPU MHz:               1263.621
Vmstat Output
Processing Jobs
  Procs
      r: The number of runnable processes (running or waiting for run time).
      b: The number of processes in uninterruptible sleep.

Memory Usage
  Memory
      swpd: the amount of virtual memory used.
      free: the amount of idle memory.
      buff: the amount of memory used as buffers.
      cache: the amount of memory used as cache.

IO Activity
  IO
      bi: Blocks received from a block device (blocks/s).
      bo: Blocks sent to a block device (blocks/s).

System Operations
  System
      in: The number of interrupts per second, including the clock.
      cs: The number of context switches per second.

CPU Resources
  CPU
      These are percentages of total CPU time.
      us: Time spent running non-kernel code.  (user time, including nice time)
      sy: Time spent running kernel code.  (system time)
      id: Time spent idle.  Prior to Linux 2.5.41, this includes IO-wait time.
      wa: Time spent waiting for IO.  Prior to Linux 2.5.41, included in idle.
      st: Time stolen from a virtual machine.  Prior to Linux 2.6.11, unknown.

Reproducibility
The overall behavior of each plot is the same when the monitoring script (vmstat.sh) is ran several times in the same machine; however, there are two cases where the plots mismatched with each other.
IO Activity
The IO Activity plots are rather similar, but the Reading activity has different ranges as it is shown below.
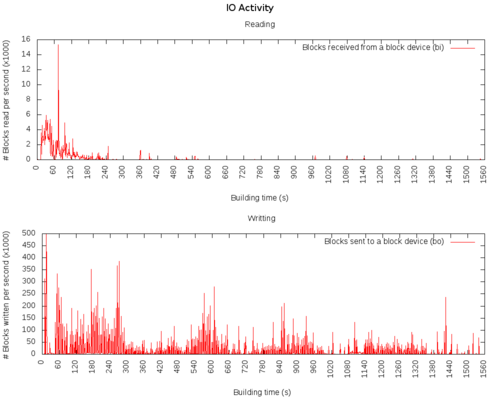
Results obtained running the script for the first time
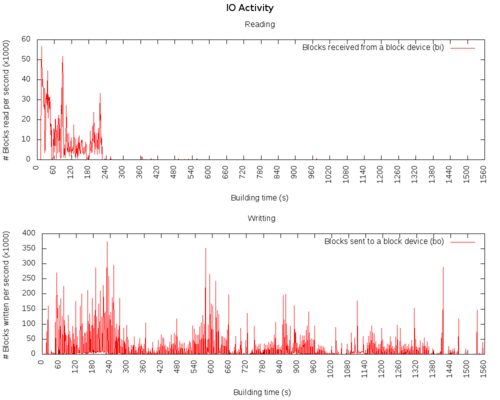
Results obtained running the script for the second time

CPU Resources
Although the behavior is quite similar between the plots, the CPU waiting time curve has different ranges as it is shown below.
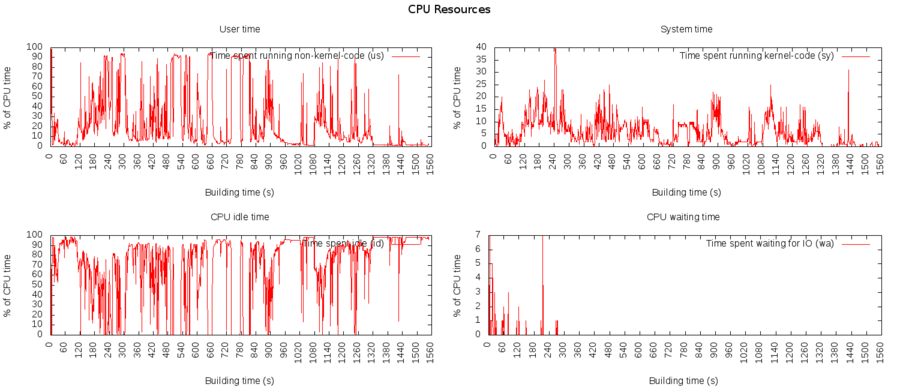
Results obtained running the script for the first time
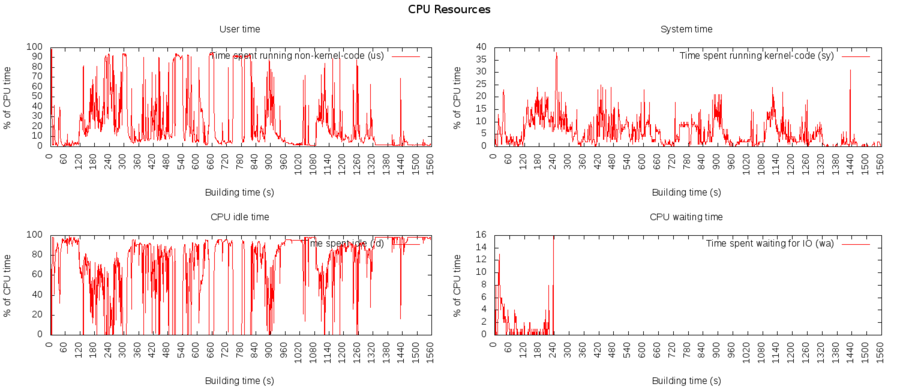
Results obtained running the script for the second time
